0.0 | Introduction
0.0 | Introduction
0.0 | Introduction
Digitising the quotation process between wood suppliers and buyers
Digitising the quotation process between wood suppliers and buyers
Digitising the quotation process between wood suppliers and buyers
Digitising the quotation process between wood suppliers and buyers
ARBO is a start-up based in Berlin, Germany. The founder are looking to optimise wood procurement by introducing an app and dashboard for the buyer and supplier: making it easier, more transparent, and more accessible for users.
ARBO is a start-up based in Berlin, Germany. The founder are looking to optimise wood procurement by introducing an app and dashboard for the buyer and supplier: making it easier, more transparent, and more accessible for users.
ARBO is a start-up based in Berlin, Germany. The founder are looking to optimise wood procurement by introducing an app and dashboard for the buyer and supplier: making it easier, more transparent, and more accessible for users.
ARBO is a start-up based in Berlin, Germany. The founder are looking to optimise wood procurement by introducing an app and dashboard for the buyer and supplier: making it easier, more transparent, and more accessible for users.

0.1 | Overview
Role
Lead UI/UX Designer
Team
Professional collaboration
6-person team
Goal
App and Dashboard (Internship)
0.2 | Statements
Problem
Wood suppliers and buyers relied on outdated, manual quotation methods that made procurement slow and inefficient. The lack of digital tools also limited transparency and trust between both parties.
Solution
In a team, I designed a consumer-based financial app and interactive dashboard to streamline communication and automate the quotation process between suppliers and buyers. This includes a real-time financial dashboard where users can monitor their total balance, investments, and recent transactions through intuitive data visualisation and interactive charts.
0.3 | Design Process
0.3 | Design Process
0.3 | Design Process
Double Diamond
Double Diamond
Double Diamond
Double Diamond
Adopted agile double diamond framework as it provided the scope to design user-based digital platforms, a dashboard and an app, to complement ARBO’s audience and the brand identity.
Adopted agile double diamond framework as it provided the scope to design user-based digital platforms, a dashboard and an app, to complement ARBO’s audience and the brand identity.
Adopted agile double diamond framework as it provided the scope to design user-based digital platforms, a dashboard and an app, to complement ARBO’s audience and the brand identity.
Adopted agile double diamond framework as it provided the scope to design user-based digital platforms, a dashboard and an app, to complement ARBO’s audience and the brand identity.
1.0 | Discover
Understanding users and exploring the market
Desk research and analysis revealed three key insights:
1
Sawmills struggle with regulation and efficiency, creating demand for sustainable, cost-effective digital tools.
2
Construction professionals face tight deadlines and rising costs, pushing them toward faster, tech-enabled sourcing solutions.
3
Existing timber platforms lack user-centric design, offering generic portals that slow fulfilment and limit engagement.

SNAG
Because the project was still in its conceptual stage, we couldn’t conduct primary research — such as interviews or surveys with Berlin’s target users — due to limited access beyond the founders. This restricted firsthand validation and relied heavily on secondary insights.
1.0 | Discover
Understanding users and exploring the market
Desk research and analysis revealed three key insights:
1
Sawmills struggle with regulation and efficiency, creating demand for sustainable, cost-effective digital tools.
2
Construction professionals face tight deadlines and rising costs, pushing them toward faster, tech-enabled sourcing solutions.
3
Existing timber platforms lack user-centric design, offering generic portals that slow fulfilment and limit engagement.

SNAG
Because the project was still in its conceptual stage, we couldn’t conduct primary research — such as interviews or surveys with Berlin’s target users — due to limited access beyond the founders. This restricted firsthand validation and relied heavily on secondary insights.
1.1 | User research

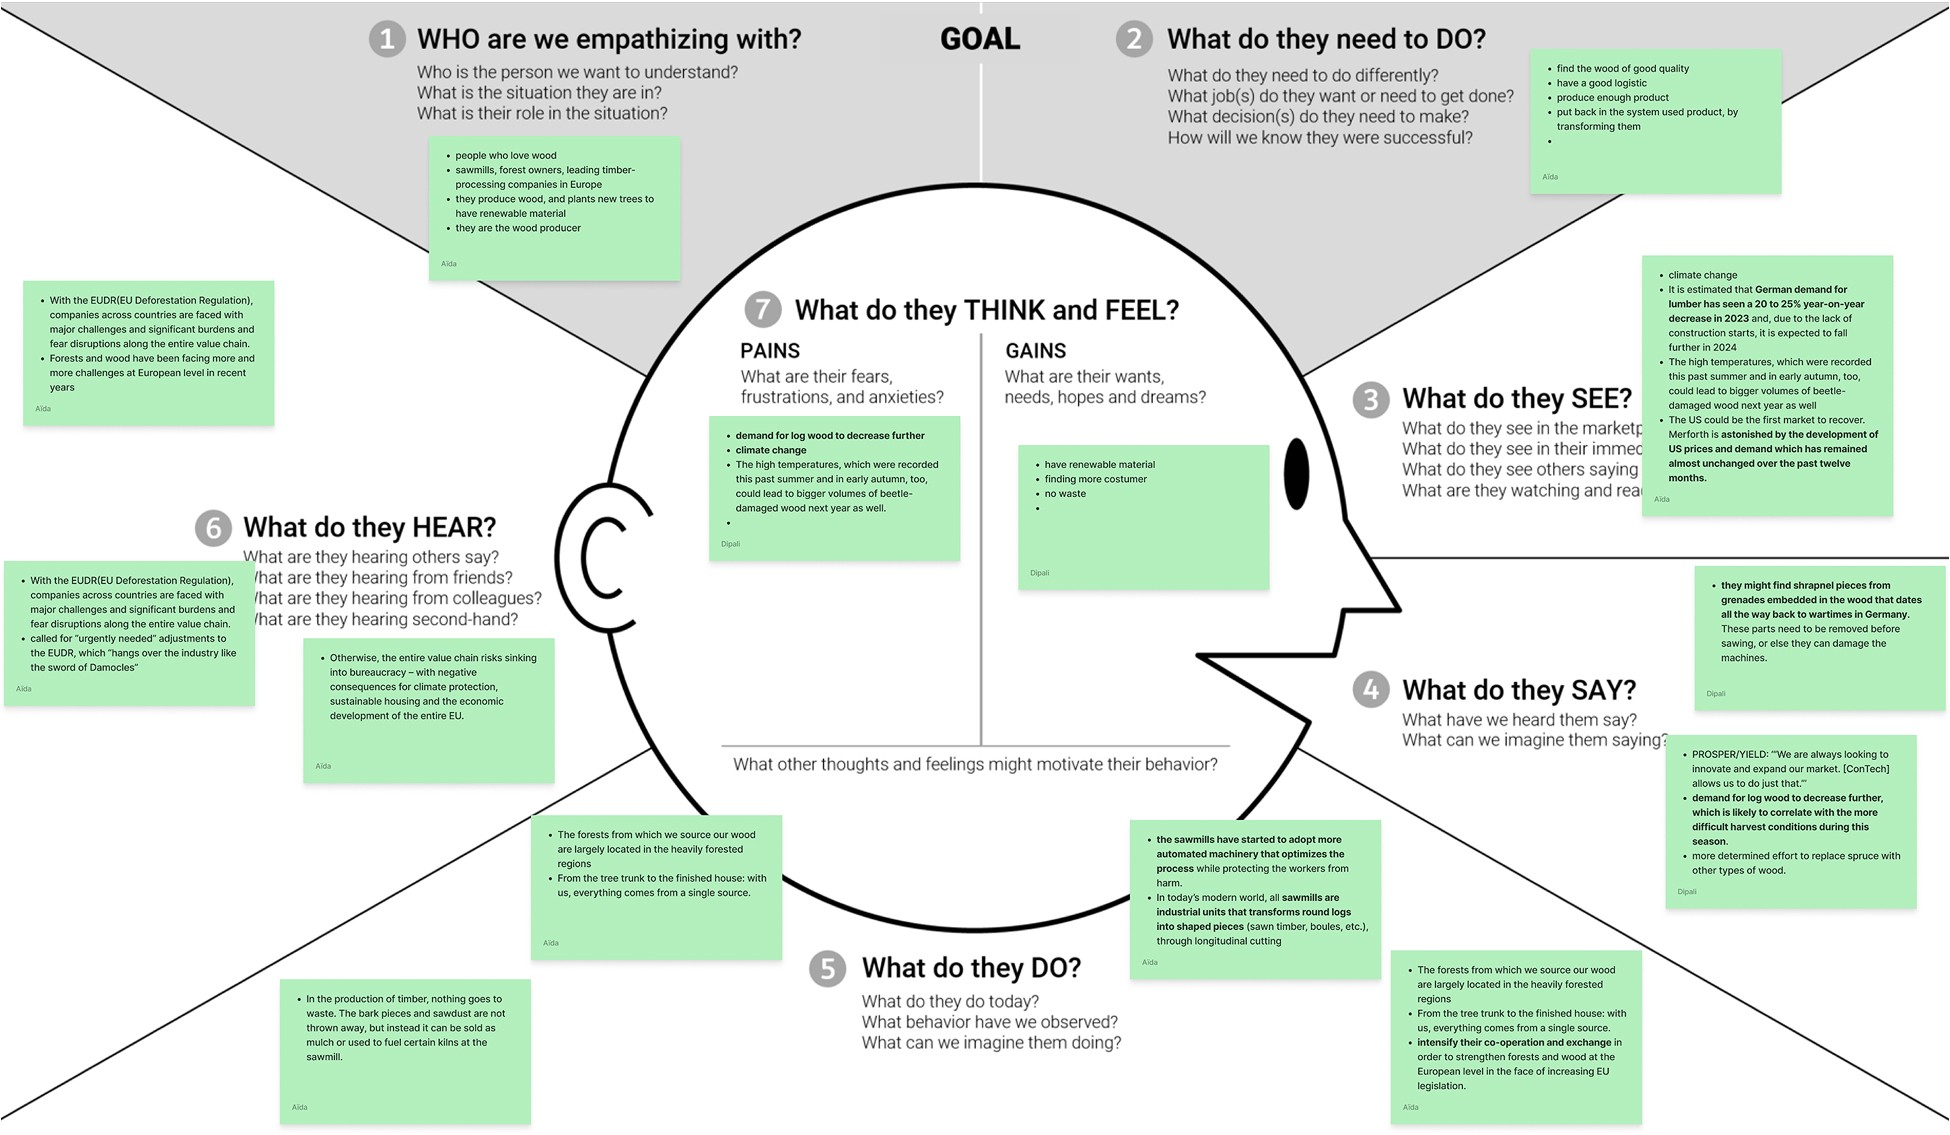
Empathising with sawmills
As a UX designer, the empathy map was a key part in understanding sawmills' challenges around EU regulations, climate change, and supply chain disruptions. Key insights revealed their need for sustainable, cost-effective solutions that minimise waste and improve operational efficiency.
Empathising with end-consumers
This empathy map focuses on carpenters and construction professionals navigating rising costs, limited time, and the push for sustainable building practices. We identified opportunities to support them with faster, tech-enabled timber sourcing that is aligned with environmental goals.
1.1 | User research
Empathising with sawmills
As a UX designer, the empathy map was a key part in understanding sawmills' challenges around EU regulations, climate change, and supply chain disruptions. Key insights revealed their need for sustainable, cost-effective solutions that minimise waste and improve operational efficiency.
Empathising with end-consumers
This empathy map focuses on carpenters and construction professionals navigating rising costs, limited time, and the push for sustainable building practices. We identified opportunities to support them with faster, tech-enabled timber sourcing that is aligned with environmental goals.
1.2 | Market research
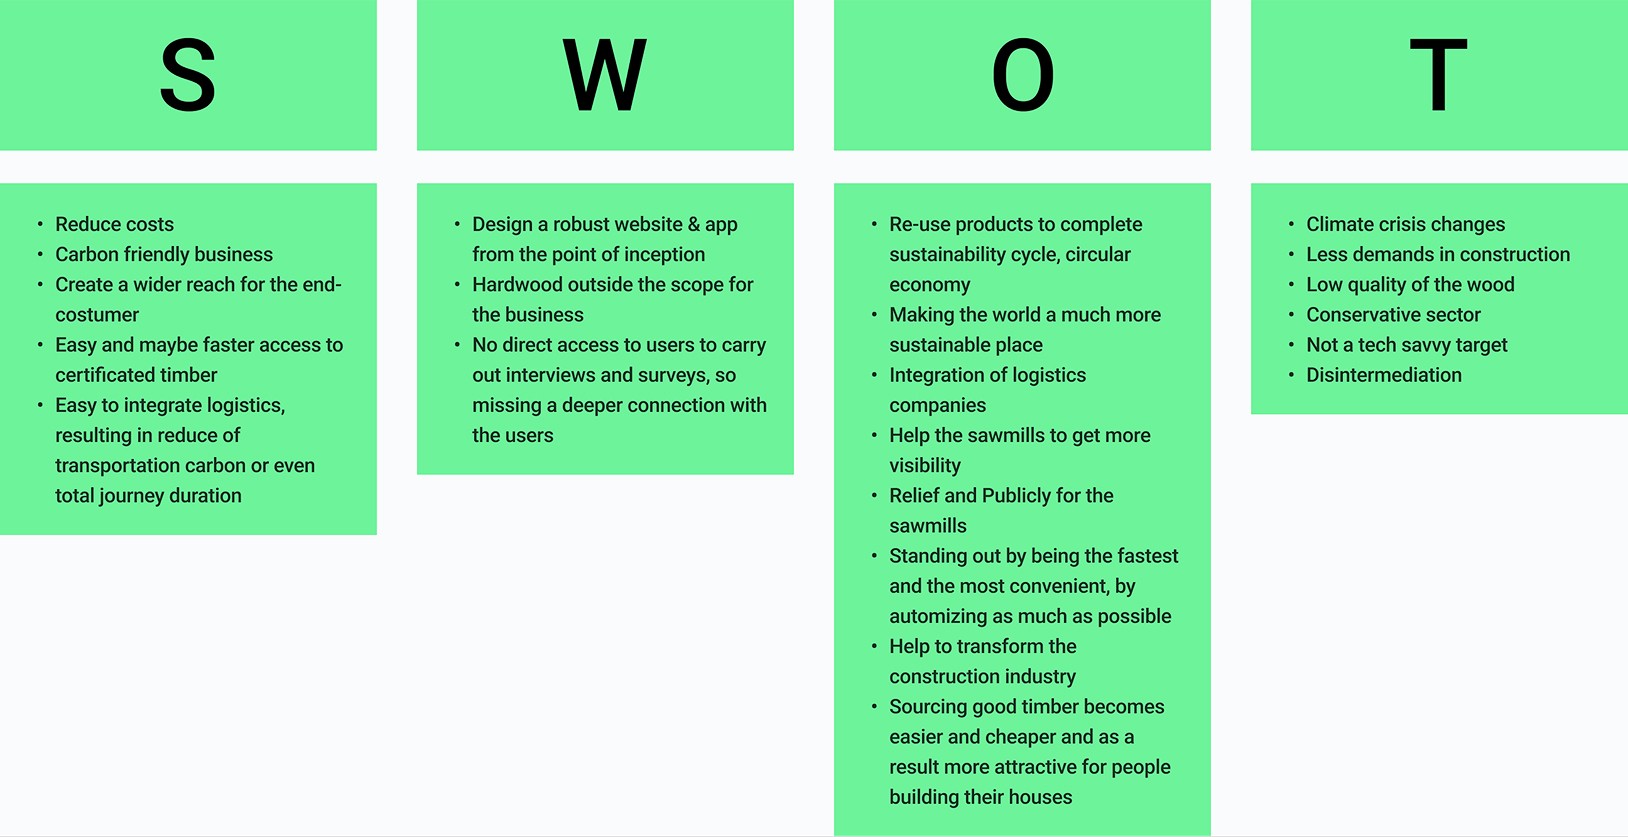
SWOT Analysis
This SWOT analysis evaluates the market potential and challenges of a sustainability-focused timber business with integrated logistics. It highlights strengths such as cost and carbon efficiency, weaknesses like limited user access, opportunities for industry-wide innovation, and threats from conservative market behaviour and climate change.
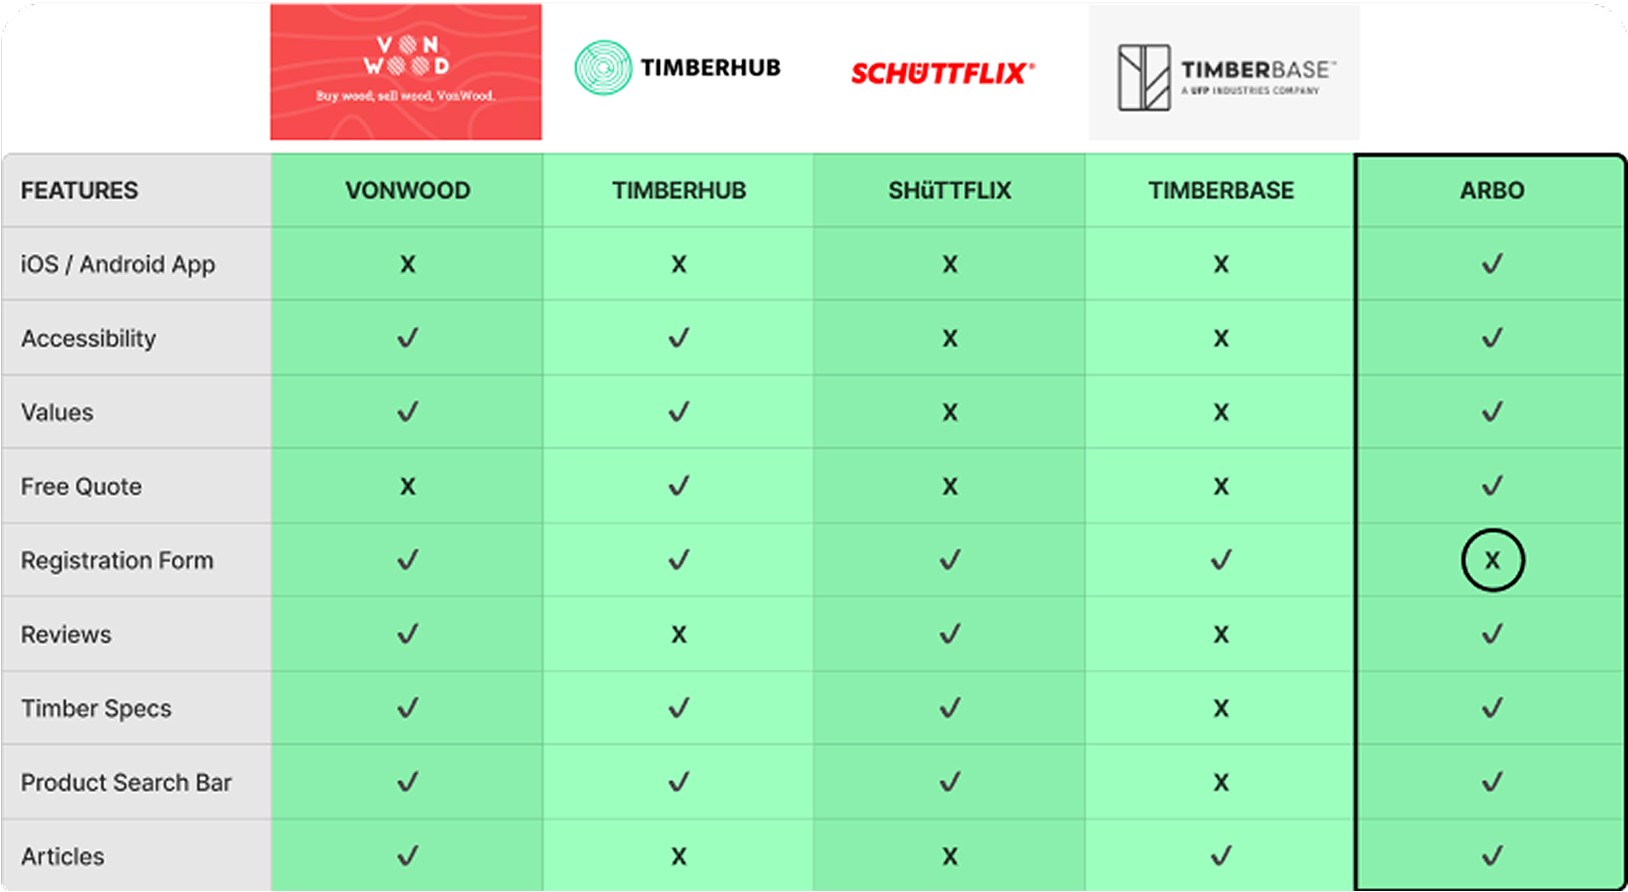
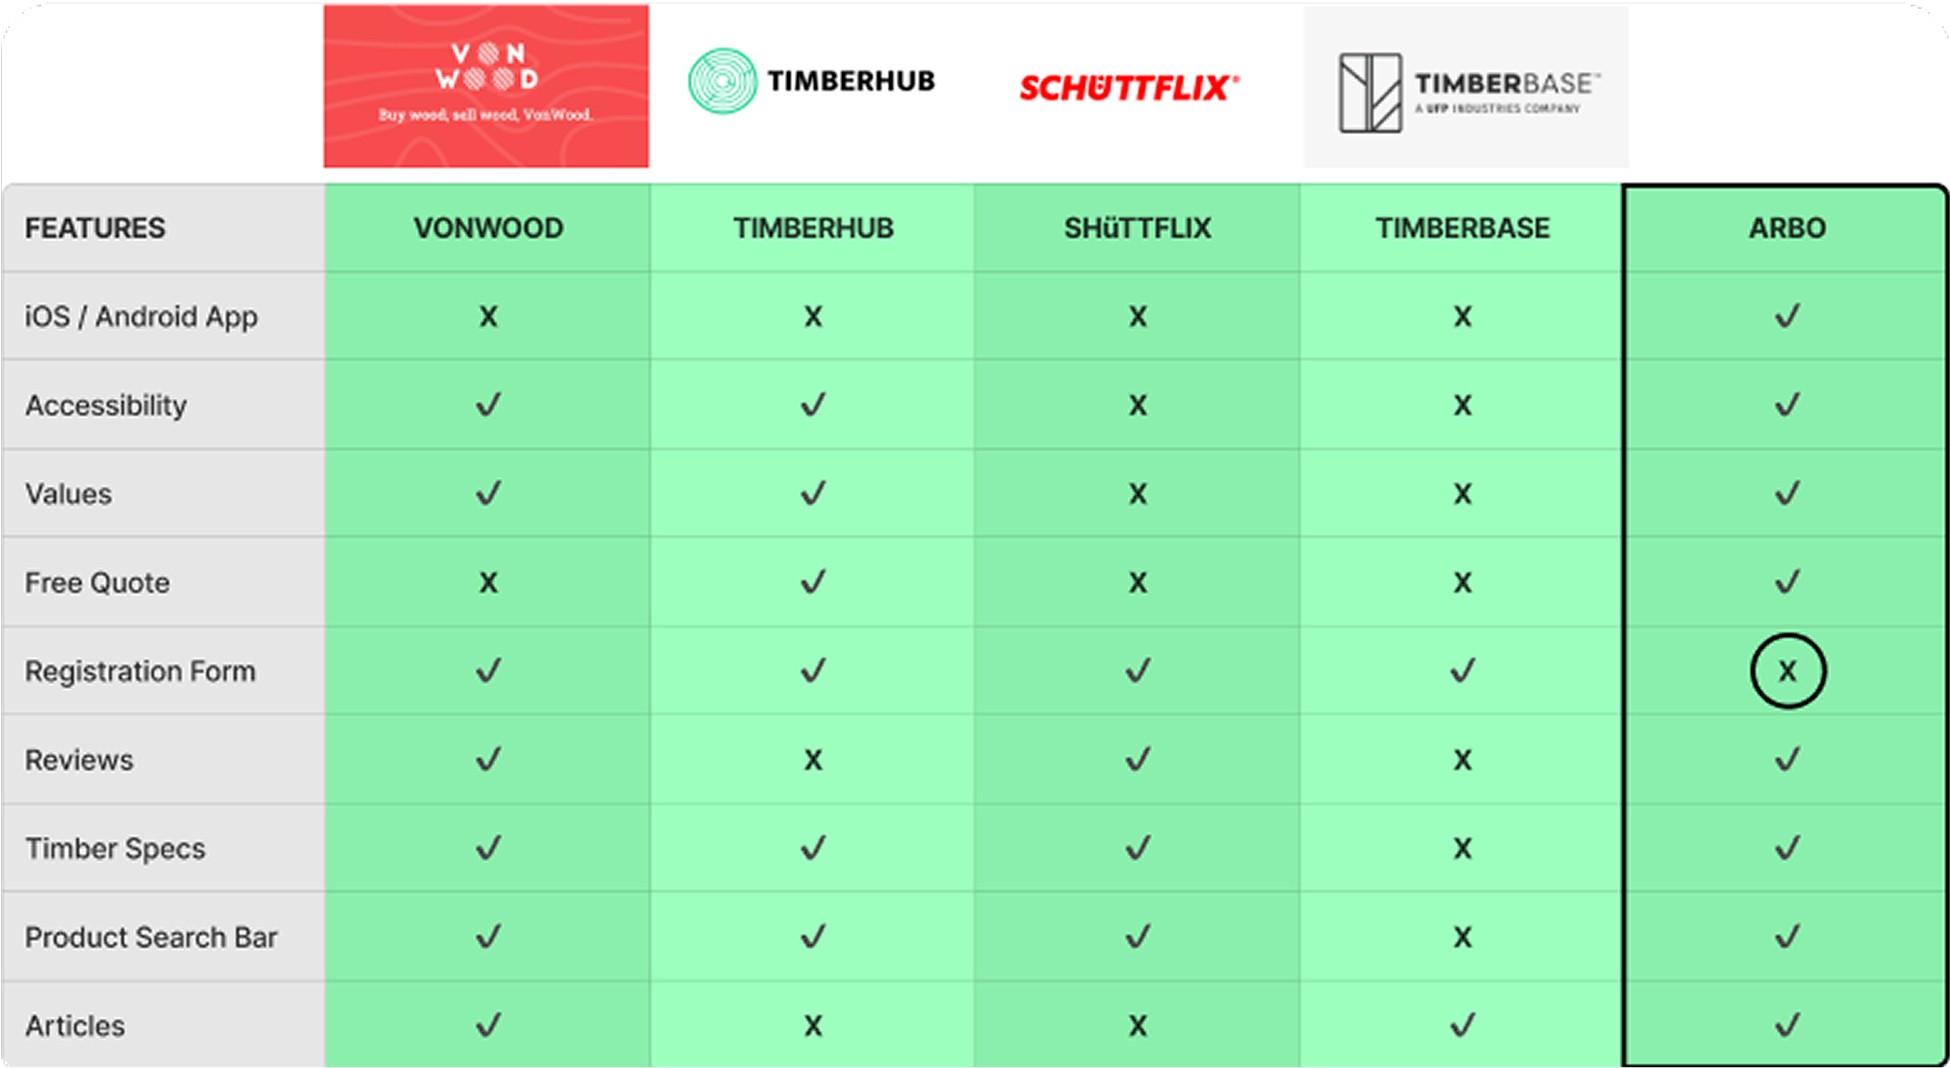
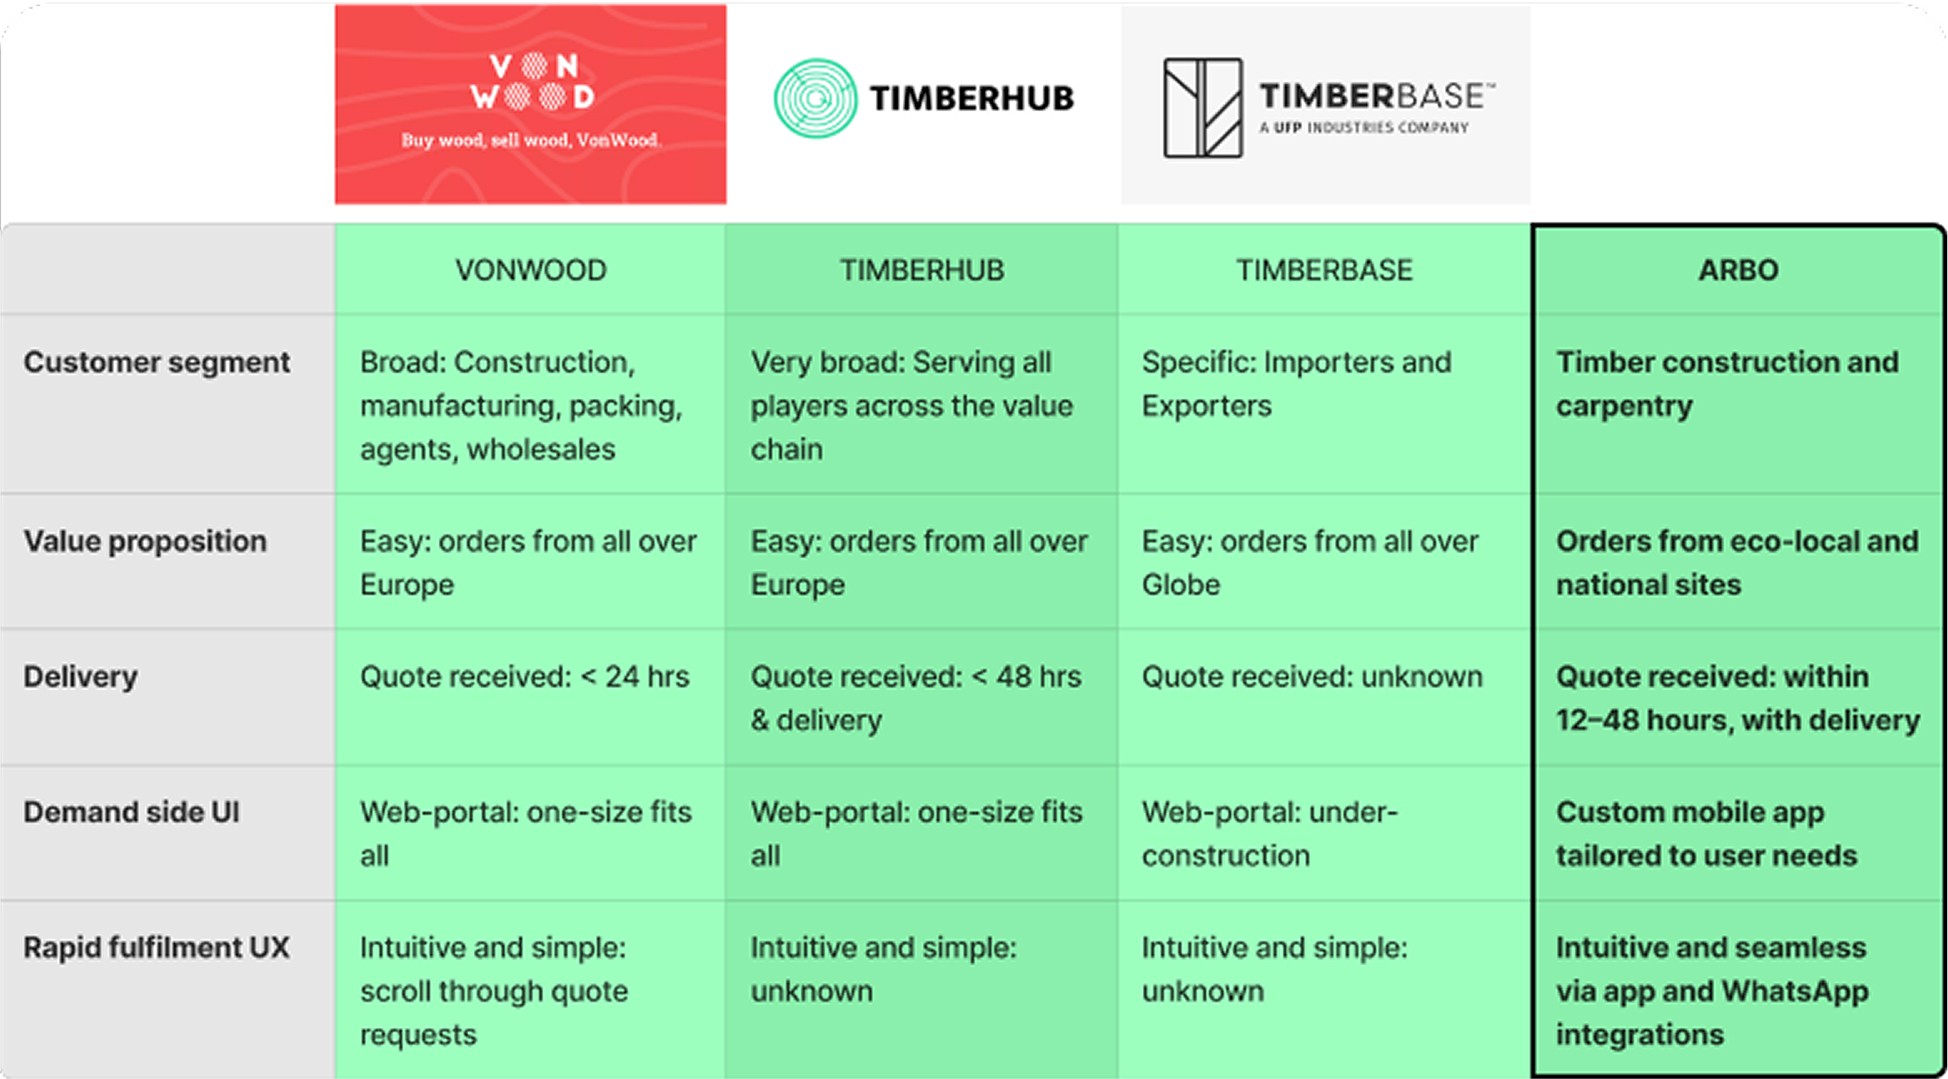
Brand Comparison Chart
ARBO’s unique selling point and key performance indicator (KPI) is to outperform existing competitors by offering the most convenient and fastest fulfilment experience.

Feature Comparison Analysis
The registration process—including logging in and signing up—has been intentionally excluded, as bypassing these steps streamlines the user journey and helps reduce order fulfilment time.
1.2 | Market research
SWOT Analysis
This SWOT analysis evaluates the market potential and challenges of a sustainability-focused timber business with integrated logistics. It highlights strengths such as cost and carbon efficiency, weaknesses like limited user access, opportunities for industry-wide innovation, and threats from conservative market behaviour and climate change.
Brand Comparison Chart
ARBO’s unique selling point and key performance indicator (KPI) is to outperform existing competitors by offering the most convenient and fastest fulfilment experience.
Feature Comparison Analysis
The registration process—including logging in and signing up—has been intentionally excluded, as bypassing these steps streamlines the user journey and helps reduce order fulfilment time.
1.2 | Market research
SWOT Analysis
This SWOT analysis evaluates the market potential and challenges of a sustainability-focused timber business with integrated logistics. It highlights strengths such as cost and carbon efficiency, weaknesses like limited user access, opportunities for industry-wide innovation, and threats from conservative market behaviour and climate change.
Brand Comparison Chart
ARBO’s unique selling point and key performance indicator (KPI) is to outperform existing competitors by offering the most convenient and fastest fulfilment experience.
Feature Comparison Analysis
The registration process—including logging in and signing up—has been intentionally excluded, as bypassing these steps streamlines the user journey and helps reduce order fulfilment time.
2.0 | Define
Understanding users and identifying key opportunities
The two personas and journey maps revealed three main insights:
1
Sawmills sought greater visibility and direct buyer communication to broaden reach and enhance sustainability.
2
Carpenters needed faster procurement and clearer supplier info to meet deadlines, reduce costs, and source confidently.
3
Both groups valued transparency and efficiency, highlighting the need for a platform linking production and demand.

SNAG
Creating two separate user journeys in a short timeframe was challenging, as it required balancing the needs of two distinct product experiences — dashboard and app — without overlapping insights or losing focus on shared goals.
2.0 | Define
Understanding users and identifying key opportunities
The two personas and journey maps revealed three main insights:
1
Sawmills sought greater visibility and direct buyer communication to broaden reach and enhance sustainability.
2
Carpenters needed faster procurement and clearer supplier info to meet deadlines, reduce costs, and source confidently.
3
Both groups valued transparency and efficiency, highlighting the need for a platform linking production and demand.

SNAG
Creating two separate user journeys in a short timeframe was challenging, as it required balancing the needs of two distinct product experiences — dashboard and app — without overlapping insights or losing focus on shared goals.
2.1 | User 1 persona
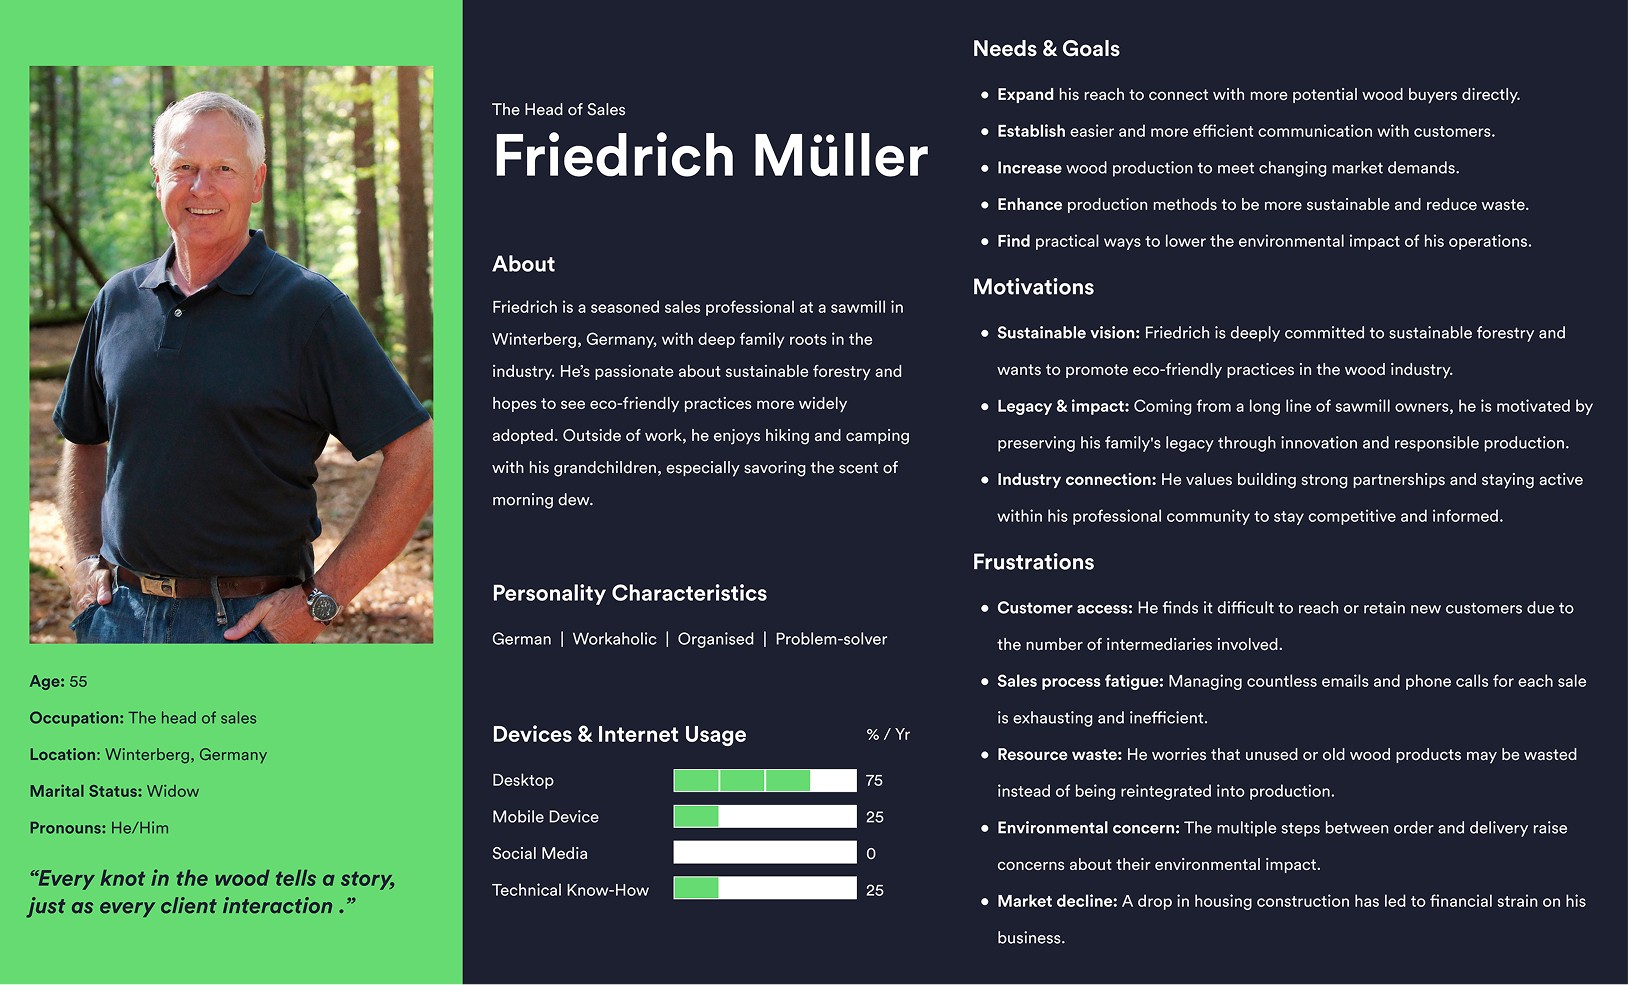
Dashboard user overview
This persona was developed through desk research to represent ARBO’s secondary user group: sawmills. It captures their key traits, goals, motivations, and pain points, serving as a foundation for informed, user-centred design decisions.
2.1 | User 1 persona
Dashboard user overview
This persona was developed through desk research to represent ARBO’s secondary user group: sawmills. It captures their key traits, goals, motivations, and pain points, serving as a foundation for informed, user-centred design decisions.
2.1 | User 1 persona

Dashboard user overview
This persona was developed through desk research to represent ARBO’s secondary user group: sawmills. It captures their key traits, goals, motivations, and pain points, serving as a foundation for informed, user-centred design decisions.
2.1 | User 1 persona
Dashboard user overview
This persona was developed through desk research to represent ARBO’s secondary user group: sawmills. It captures their key traits, goals, motivations, and pain points, serving as a foundation for informed, user-centred design decisions.
2.1 | User 1 persona
Dashboard user overview
This persona was developed through desk research to represent ARBO’s secondary user group: sawmills. It captures their key traits, goals, motivations, and pain points, serving as a foundation for informed, user-centred design decisions.
2.1 | User 1 persona
Dashboard user overview
This persona was developed through desk research to represent ARBO’s secondary user group: sawmills. It captures their key traits, goals, motivations, and pain points, serving as a foundation for informed, user-centred design decisions.
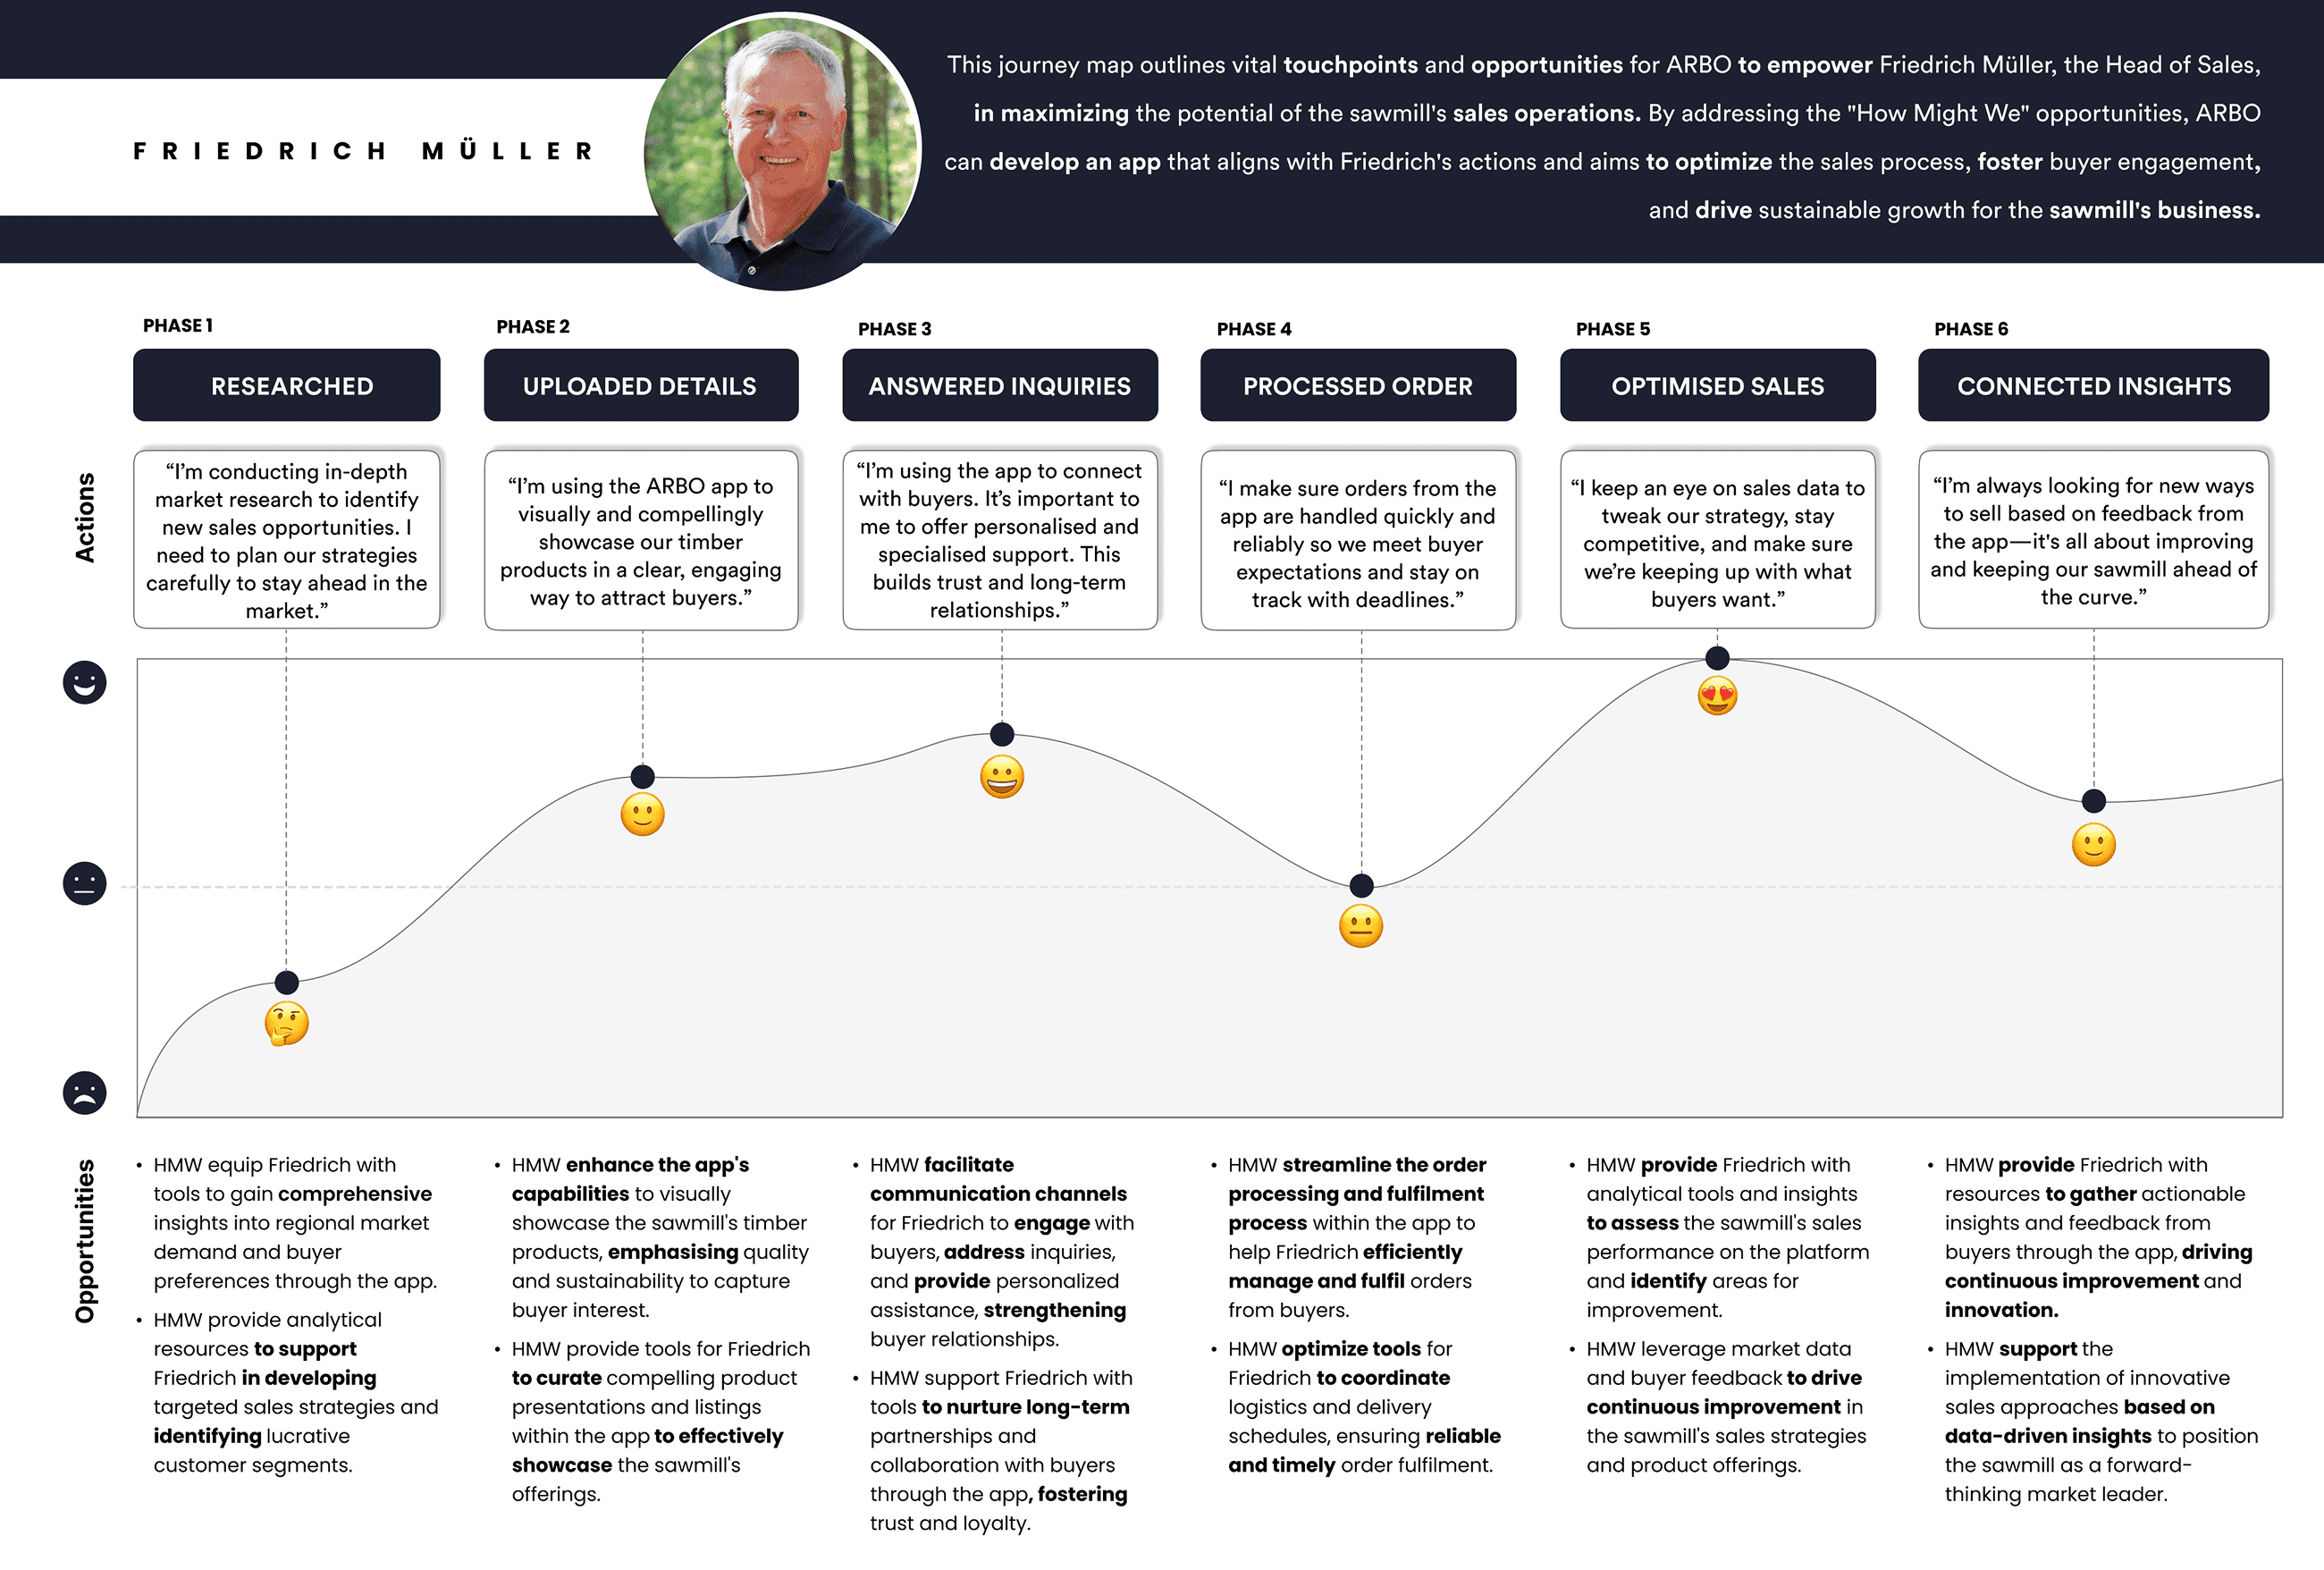
2.2 | User 1 journey map

Usage opportunities
Friedrich’s key opportunities are to: (1) gather insights to inform strategy, (2) connect with buyers to build trust, and (3) use data to streamline sales and drive continuous improvement — because these actions help him stay competitive, meet buyer needs, and grow the sawmill’s business sustainably.
2.2 | User 1 journey map
Usage opportunities
Friedrich’s key opportunities are to: (1) gather insights to inform strategy, (2) connect with buyers to build trust, and (3) use data to streamline sales and drive continuous improvement — because these actions help him stay competitive, meet buyer needs, and grow the sawmill’s business sustainably.
2.3 | User 2 persona
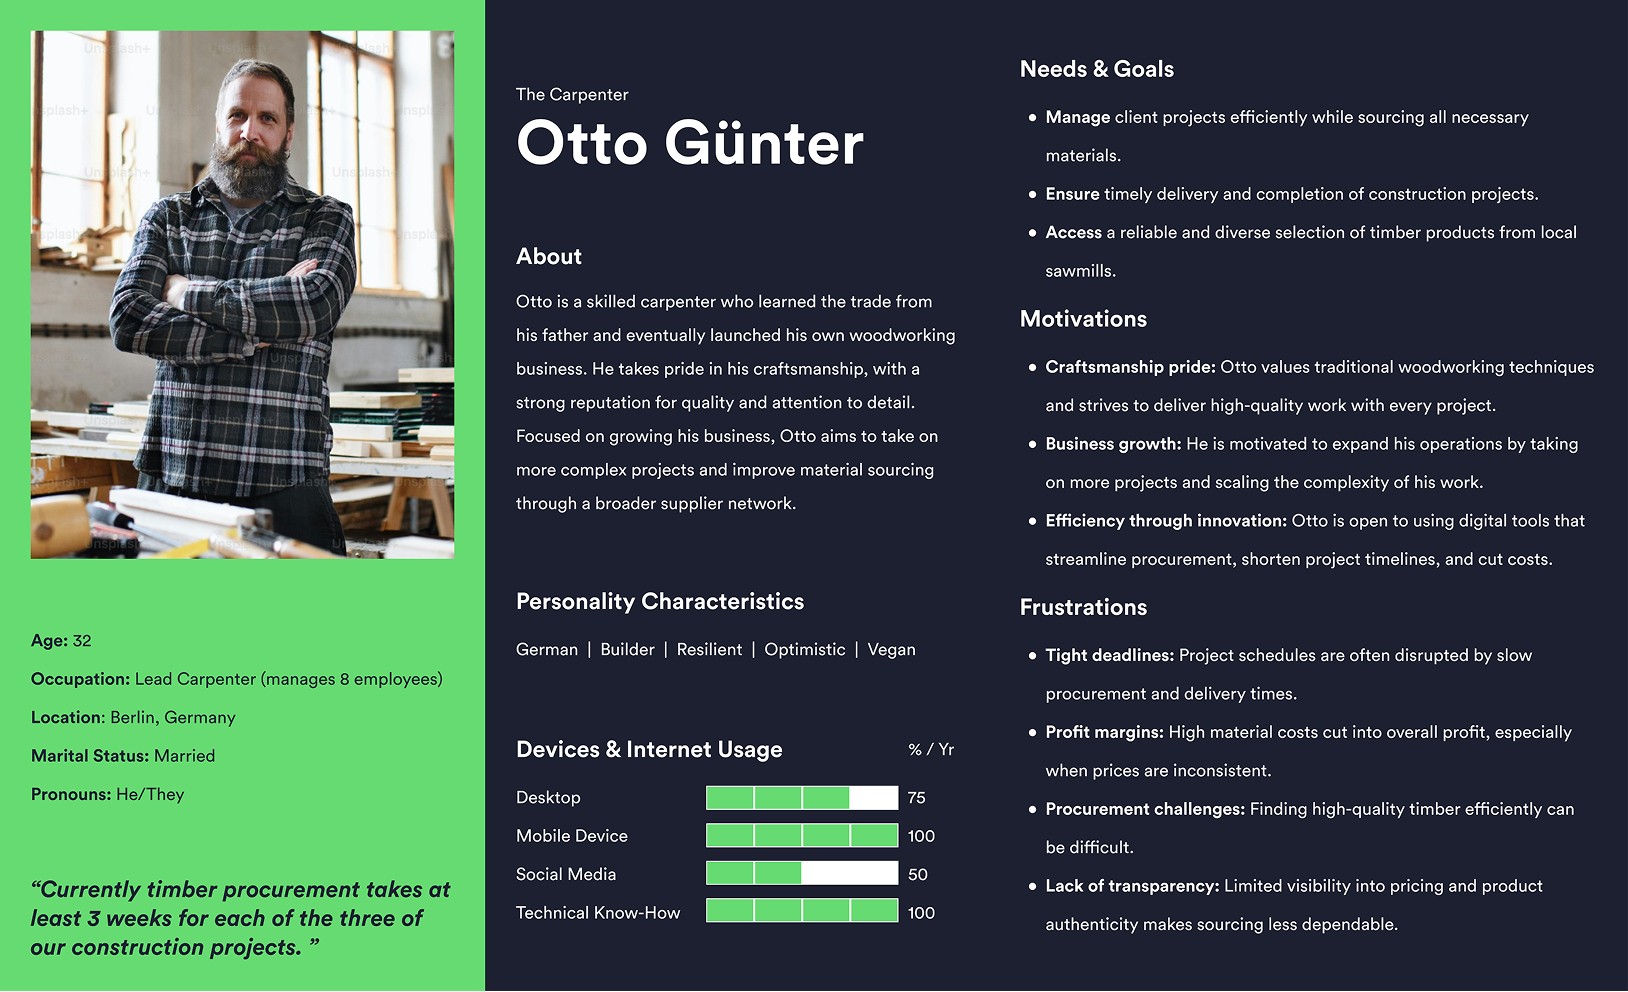
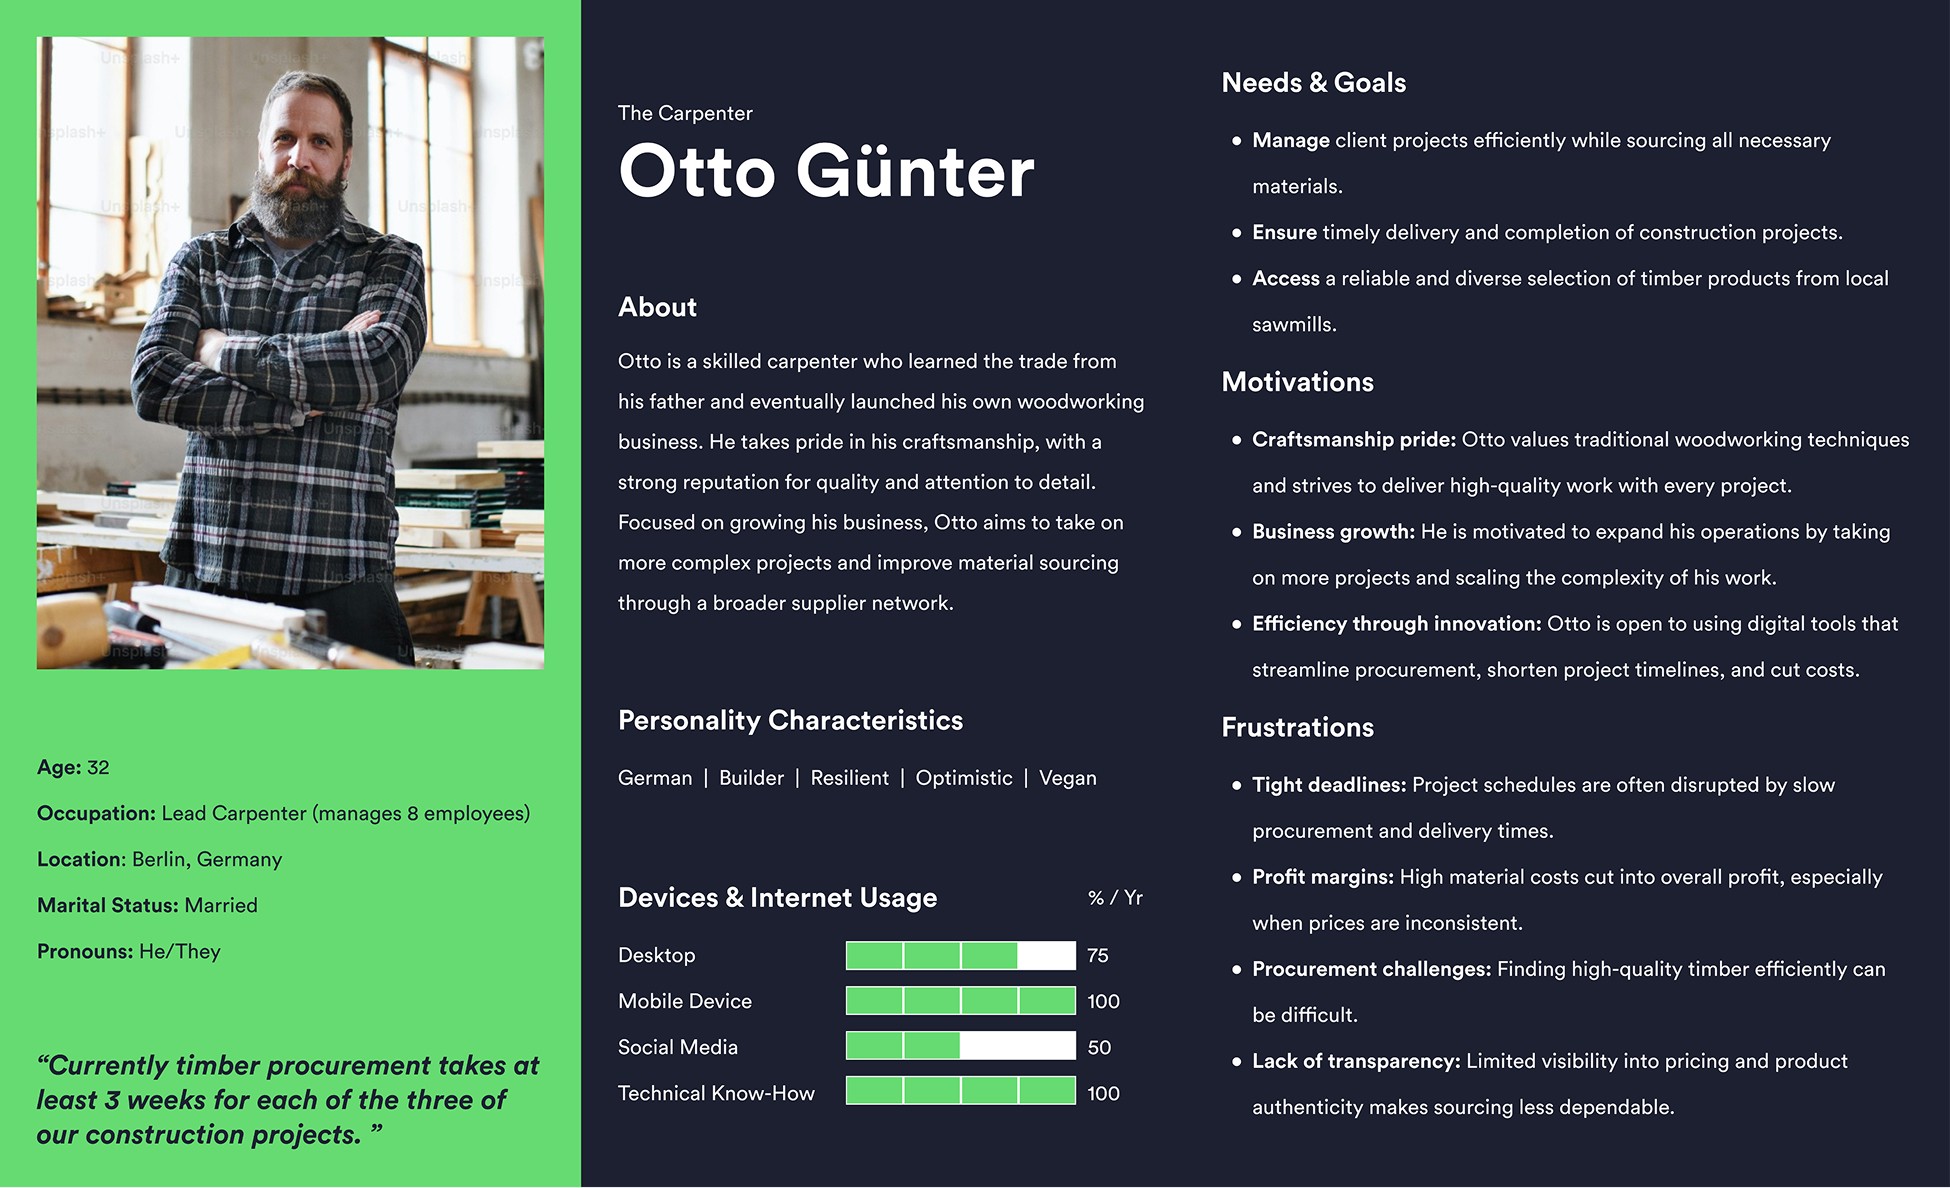
App user overview
This persona was developed through desk research to represent ARBO’s primary user group — carpenters. It captures their key traits, goals, motivations, and pain points, serving as a foundation for thoughtful, user-centred design decisions.
2.3 | User 2 persona
App user overview
This persona was developed through desk research to represent ARBO’s primary user group — carpenters. It captures their key traits, goals, motivations, and pain points, serving as a foundation for thoughtful, user-centred design decisions.
2.3 | User 2 persona
App user overview
This persona was developed through desk research to represent ARBO’s primary user group — carpenters. It captures their key traits, goals, motivations, and pain points, serving as a foundation for thoughtful, user-centred design decisions.
2.3 | User 2 persona
App user overview
This persona was developed through desk research to represent ARBO’s primary user group — carpenters. It captures their key traits, goals, motivations, and pain points, serving as a foundation for thoughtful, user-centred design decisions.
2.3 | User 2 persona
App user overview
This persona was developed through desk research to represent ARBO’s primary user group — carpenters. It captures their key traits, goals, motivations, and pain points, serving as a foundation for thoughtful, user-centred design decisions.
2.3 | User 2 persona
App user overview
This persona was developed through desk research to represent ARBO’s primary user group — carpenters. It captures their key traits, goals, motivations, and pain points, serving as a foundation for thoughtful, user-centred design decisions.
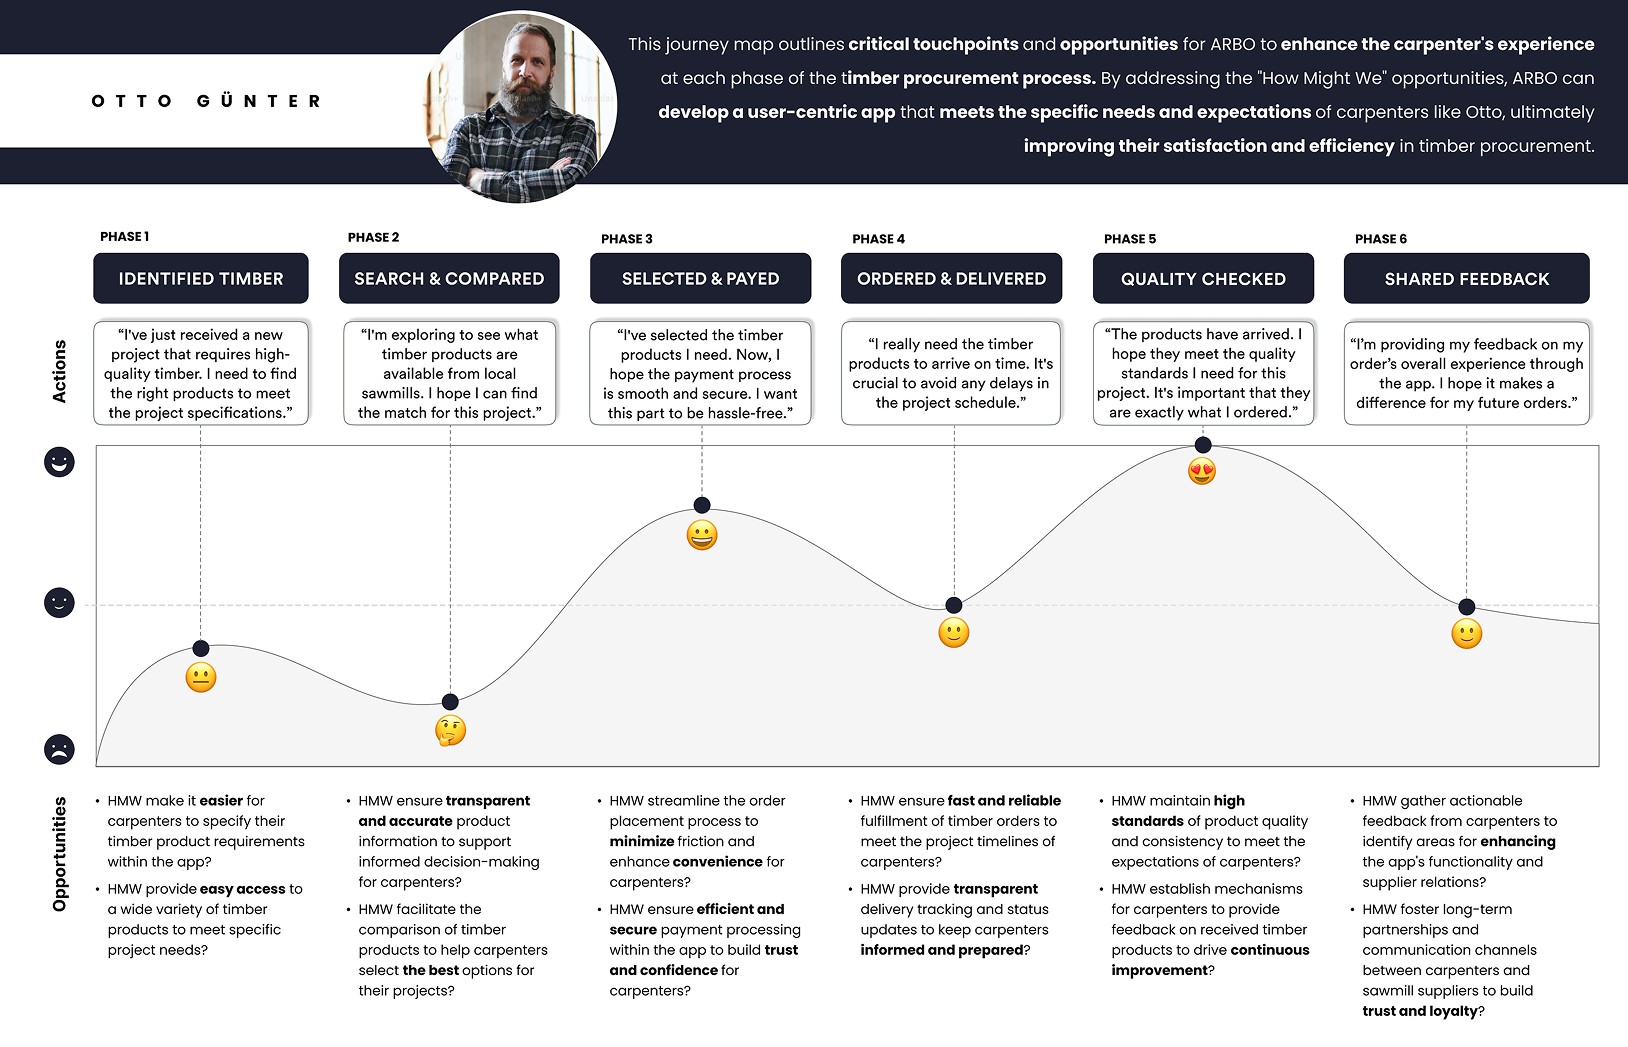
2.4 | User 2 journey map
Usage opportunities
Otto’s key opportunities are to: (1) streamline timber procurement, (2) access reliable, transparent supplier info, and (3) manage project timelines more efficiently—because this helps him meet tight deadlines, protect profit margins, and grow his woodworking business with confidence.
2.4 | User 2 journey map
Usage opportunities
Otto’s key opportunities are to: (1) streamline timber procurement, (2) access reliable, transparent supplier info, and (3) manage project timelines more efficiently—because this helps him meet tight deadlines, protect profit margins, and grow his woodworking business with confidence.
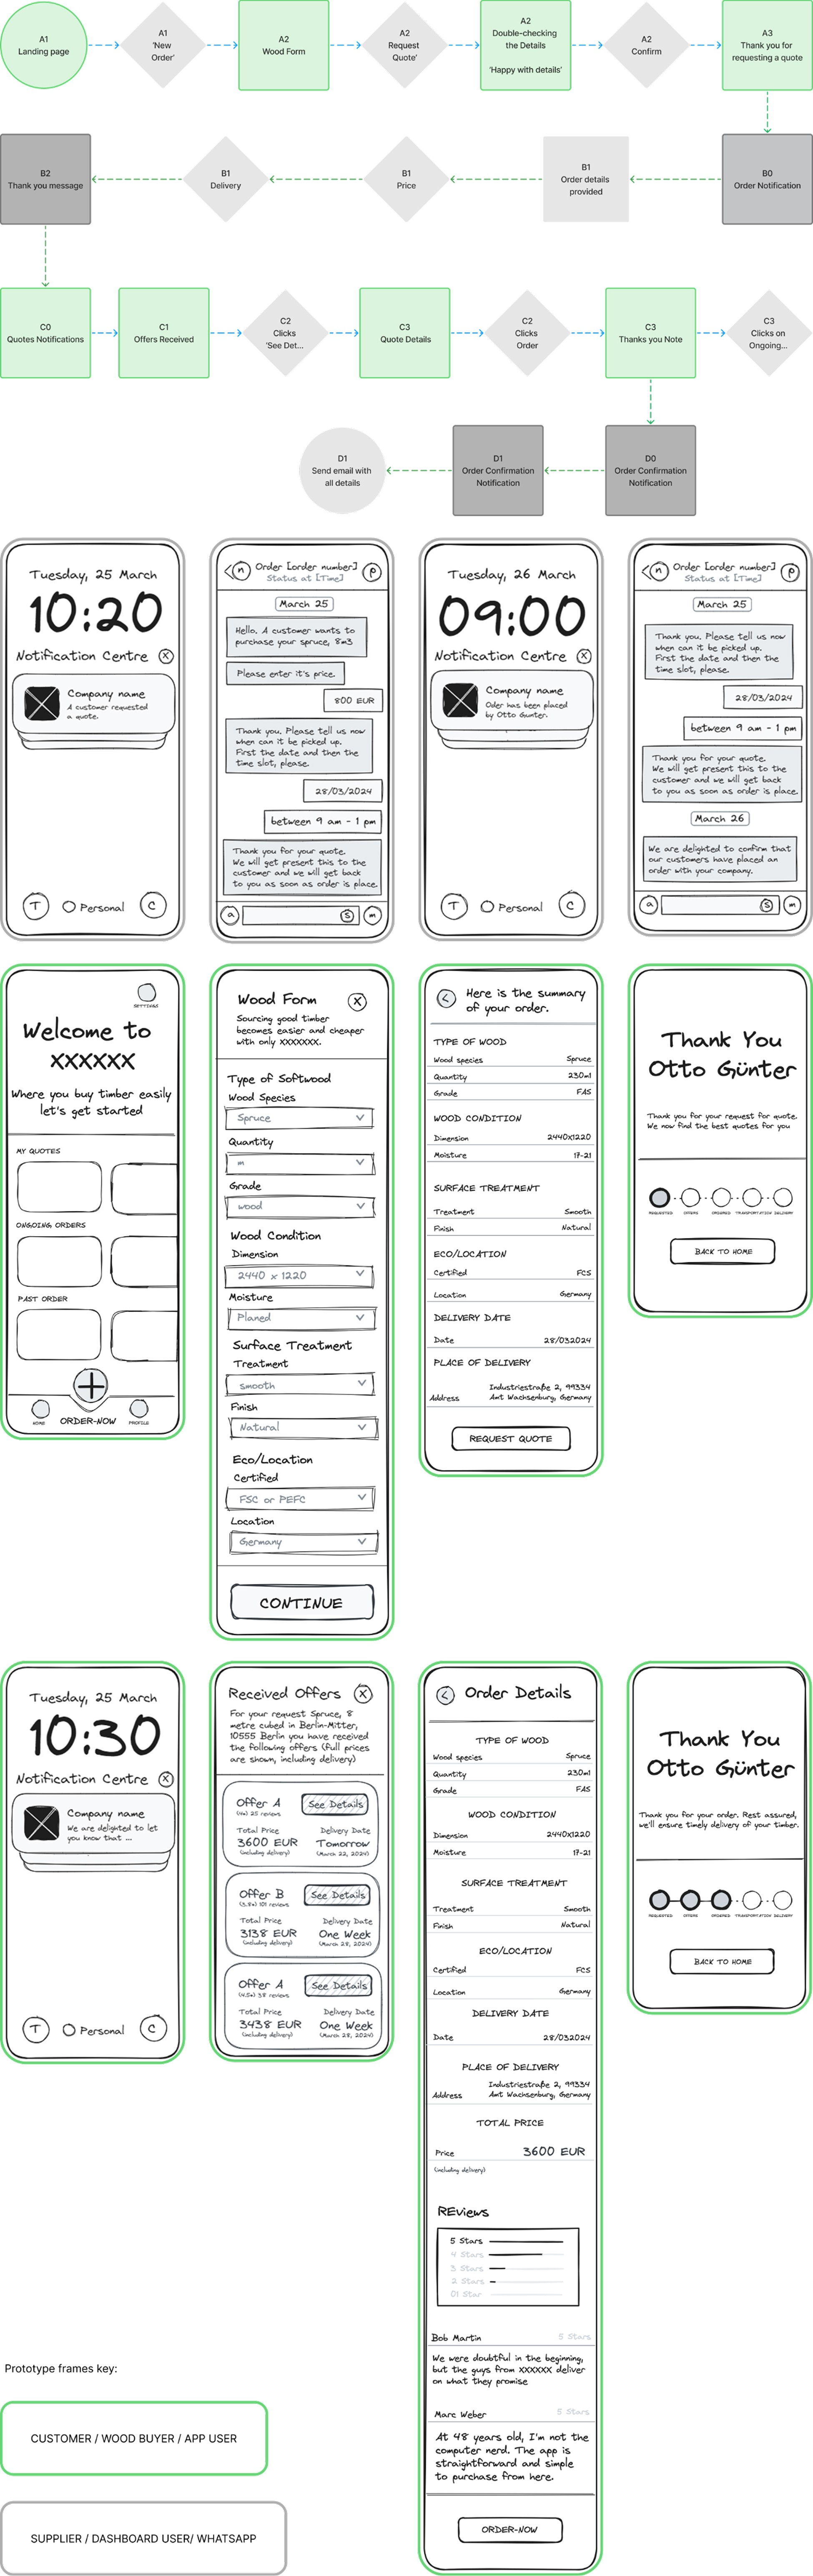
2.5 | Navigation path
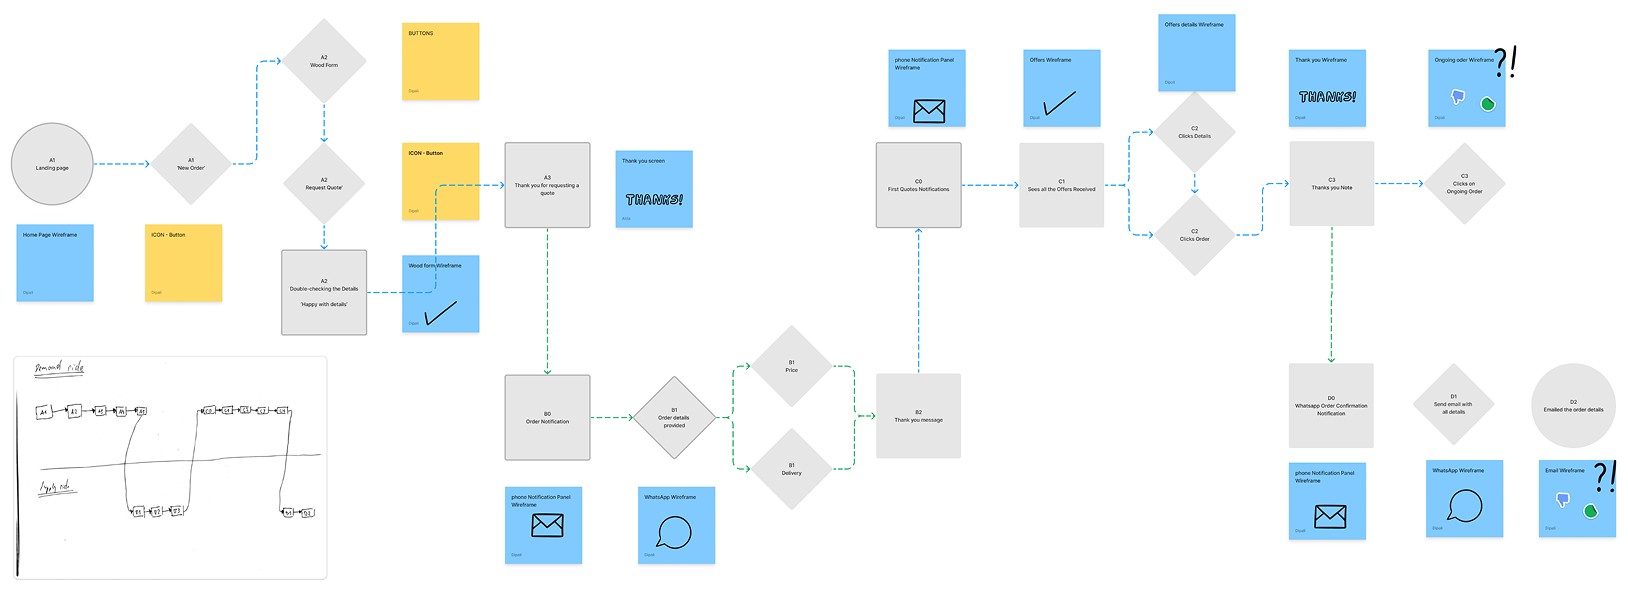
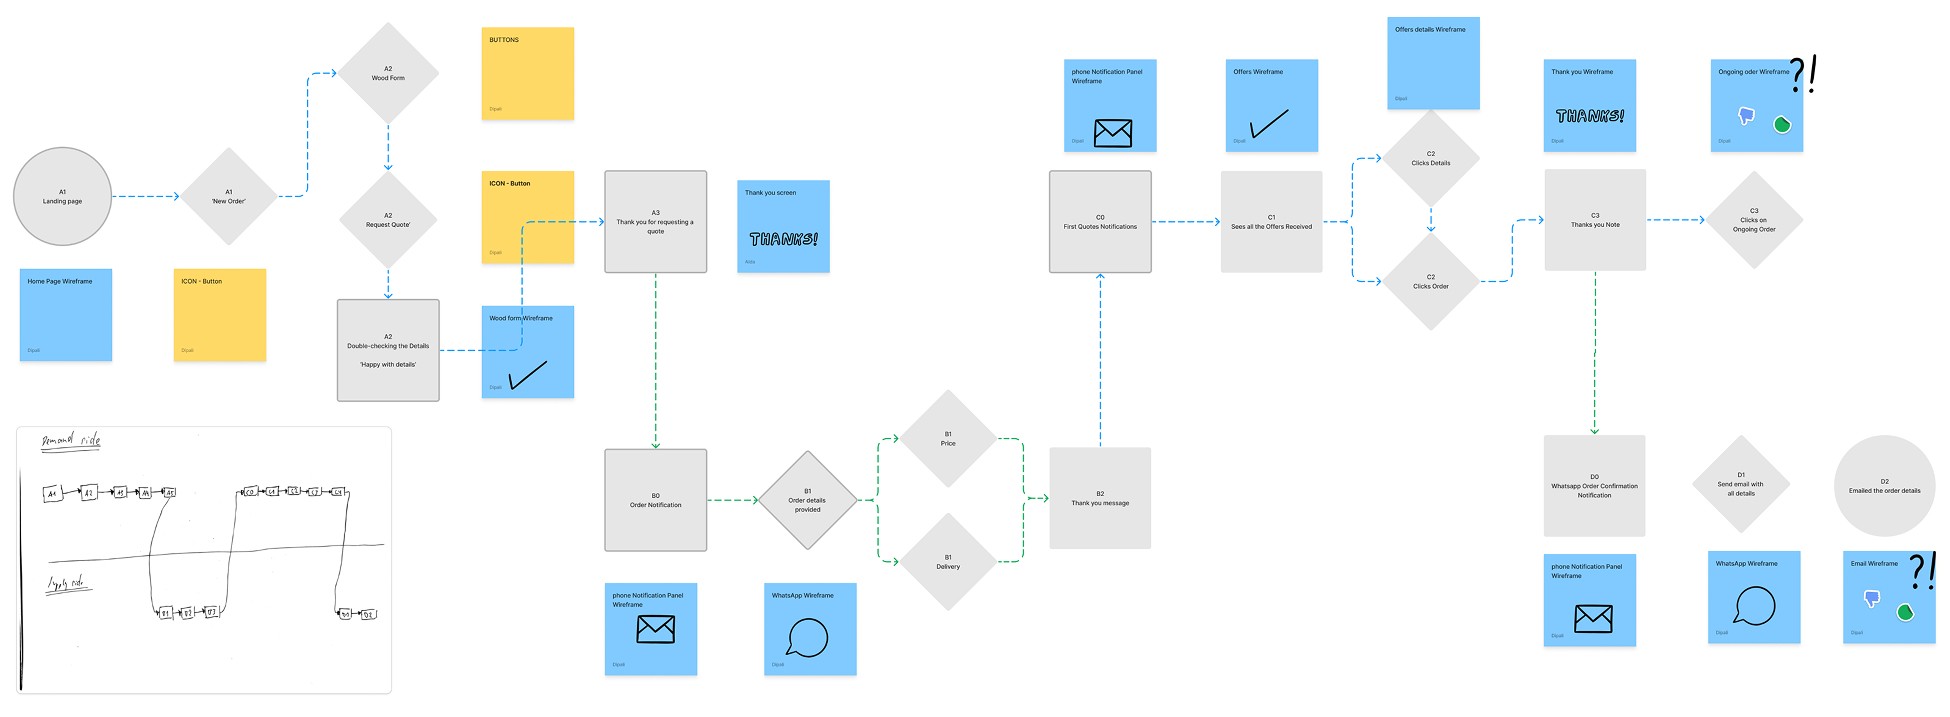
Visualising best flow for users
This is a detailed user flow diagram showing the ideal navigation path for users completing key tasks within the platform. This happy path highlights decision points, system interactions, and user feedback loops to ensure a seamless and intuitive journey.
2.5 | Navigation path
Visualising best flow for users
This is a detailed user flow diagram showing the ideal navigation path for users completing key tasks within the platform. This happy path highlights decision points, system interactions, and user feedback loops to ensure a seamless and intuitive journey.
3.0 | Develop
Building Structure, Consistency, and Visual Direction
Distilling tasks to create high-fi wireframes into three key insights:
1
Low-fidelity prototypes clarified the quoting flow and revealed gaps between order, offer, and confirmation screens.
2
Establishing a modular design system ensured visual consistency across interactions, supporting scalability as the product grew.
3
Early visual exploration and accessibility testing refined the aesthetic direction and ensured WCAG-compliant colours.

SNAG
Limited time and fragmented early research made it difficult to fully validate user expectations for complex quoting and order-tracking flows.
3.0 | Develop
Building Structure, Consistency, and Visual Direction
Distilling tasks to create high-fi wireframes into three key insights:
1
Low-fidelity prototypes clarified the quoting flow and revealed gaps between order, offer, and confirmation screens.
2
Establishing a modular design system ensured visual consistency across interactions, supporting scalability as the product grew.
3
Early visual exploration and accessibility testing refined the aesthetic direction and ensured WCAG-compliant colours.

SNAG
Limited time and fragmented early research made it difficult to fully validate user expectations for complex quoting and order-tracking flows.
3.1 | Concept tests

Early stage concept exploration
Low-fidelity wireframes illustrating the initial happy path for the mobile app. The layout prioritises usability and clarity, mapping out core user tasks like logging in, product selection, and order tracking before moving into high-fidelity designs.
3.1 | Concept tests
Early stage concept exploration
Low-fidelity wireframes illustrating the initial happy path for the mobile app. The layout prioritises usability and clarity, mapping out core user tasks like logging in, product selection, and order tracking before moving into high-fidelity designs.
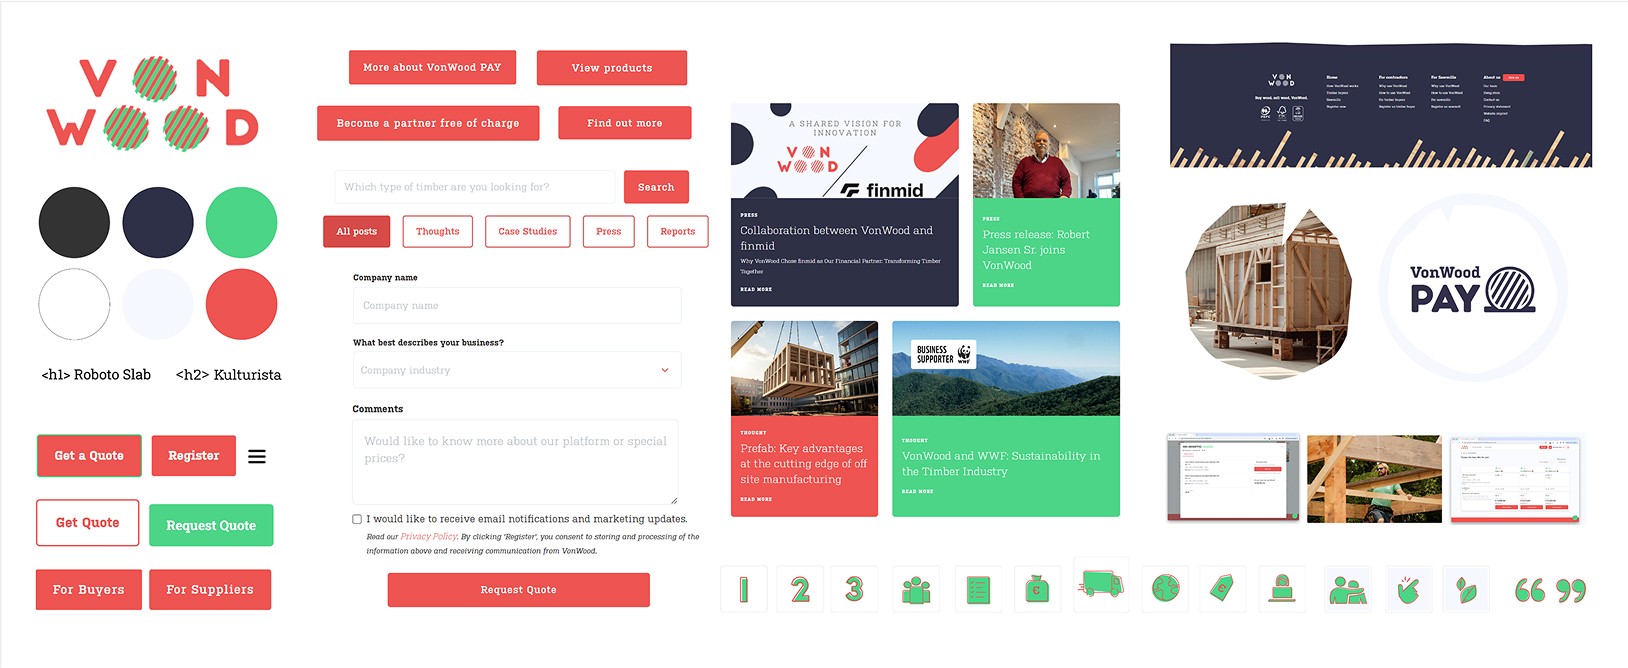
3.2 | Design system 1
A Consistent Visual System
The VonWood design system includes core UI components, brand colours, typography, and button styles. This foundation ensures consistency across all digital touchpoints while supporting scalable product development.
3.2 | Design system 1
A Consistent Visual System
The VonWood design system includes core UI components, brand colours, typography, and button styles. This foundation ensures consistency across all digital touchpoints while supporting scalable product development.
3.2 | Design system 1

A Consistent Visual System
The VonWood design system includes core UI components, brand colours, typography, and button styles. This foundation ensures consistency across all digital touchpoints while supporting scalable product development.
3.2 | Design system 1
A Consistent Visual System
The VonWood design system includes core UI components, brand colours, typography, and button styles. This foundation ensures consistency across all digital touchpoints while supporting scalable product development.
3.2 | Design system 1
A Consistent Visual System
The VonWood design system includes core UI components, brand colours, typography, and button styles. This foundation ensures consistency across all digital touchpoints while supporting scalable product development.
3.2 | Design system 1
A Consistent Visual System
The VonWood design system includes core UI components, brand colours, typography, and button styles. This foundation ensures consistency across all digital touchpoints while supporting scalable product development.
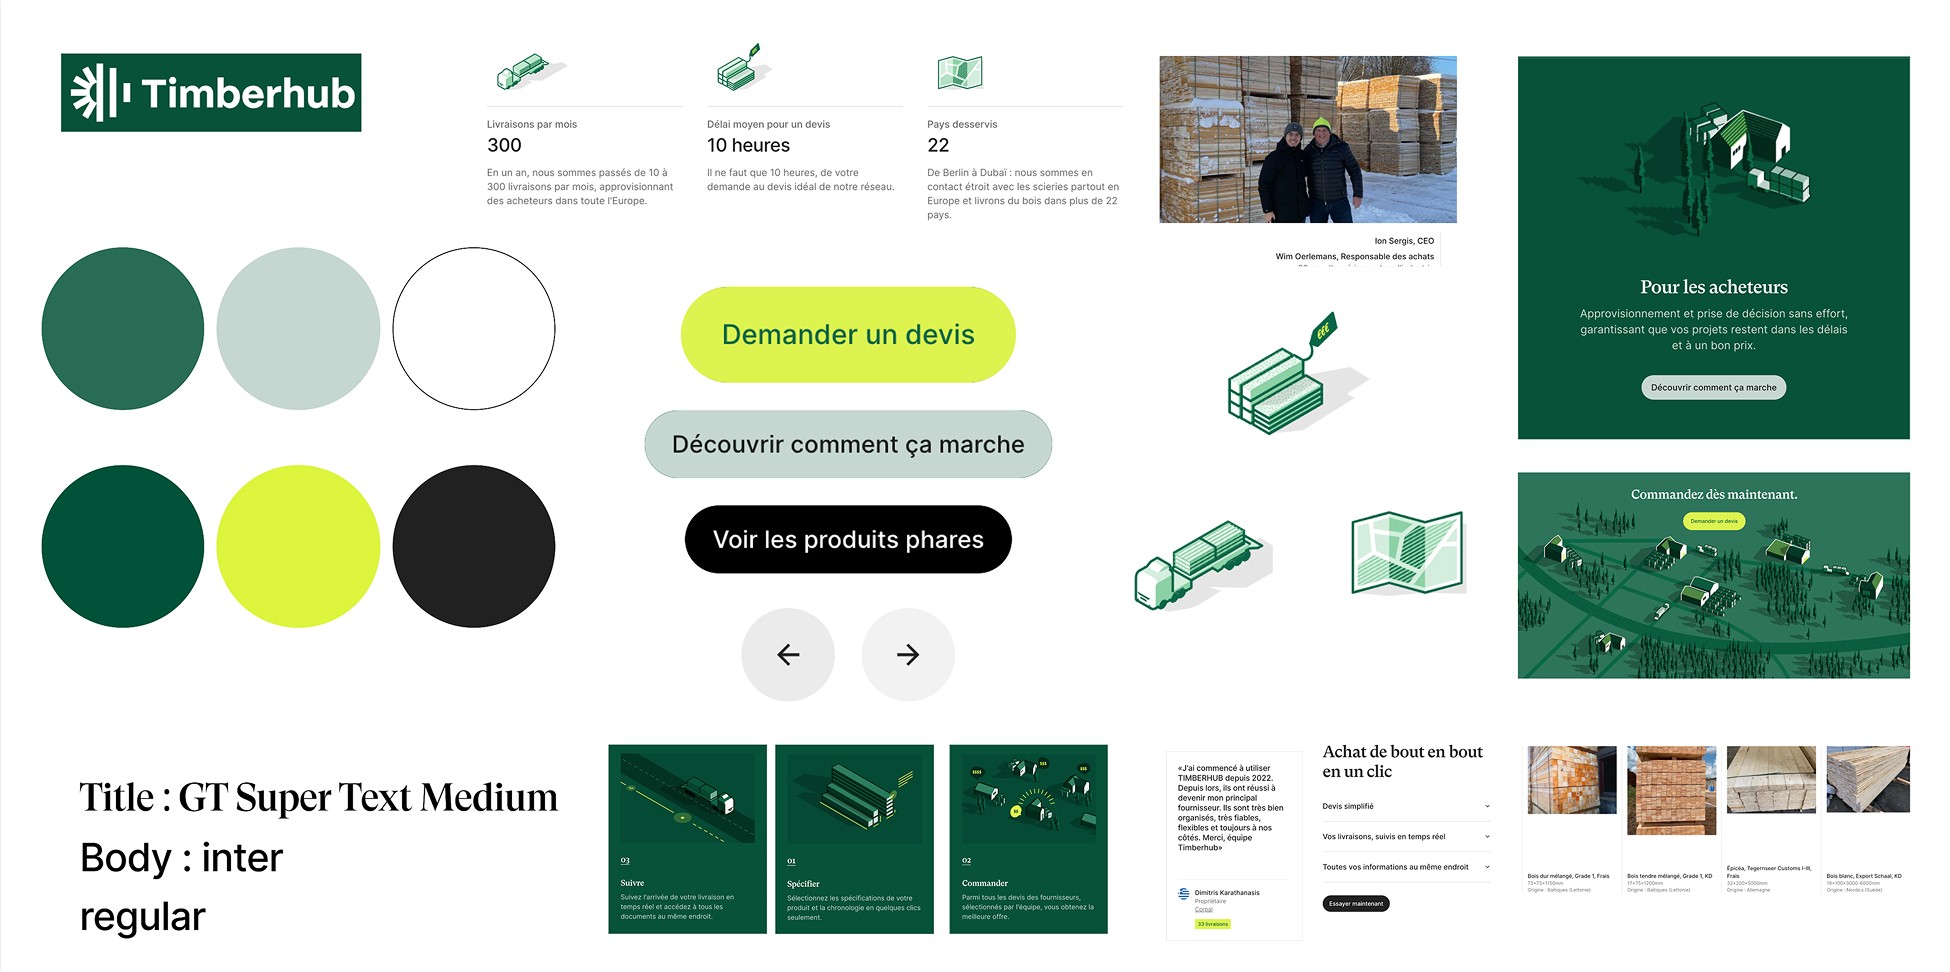
3.3 | Design system 2

Streamlining the ecosystem
A modular design system for Timberhub, featuring a bold green colour palette, clean typography, and custom illustrations. It supports a user-focused experience across landing pages and digital tools, helping users navigate and interact confidently.
3.3 | Design system 2
Streamlining the ecosystem
A modular design system for Timberhub, featuring a bold green colour palette, clean typography, and custom illustrations. It supports a user-focused experience across landing pages and digital tools, helping users navigate and interact confidently.
3.3 | Design system 2
Streamlining the ecosystem
A modular design system for Timberhub, featuring a bold green colour palette, clean typography, and custom illustrations. It supports a user-focused experience across landing pages and digital tools, helping users navigate and interact confidently.
3.3 | Design system 2
Streamlining the ecosystem
A modular design system for Timberhub, featuring a bold green colour palette, clean typography, and custom illustrations. It supports a user-focused experience across landing pages and digital tools, helping users navigate and interact confidently.
3.3 | Design system 2
Streamlining the ecosystem
A modular design system for Timberhub, featuring a bold green colour palette, clean typography, and custom illustrations. It supports a user-focused experience across landing pages and digital tools, helping users navigate and interact confidently.
3.3 | Design system 2
Streamlining the ecosystem
A modular design system for Timberhub, featuring a bold green colour palette, clean typography, and custom illustrations. It supports a user-focused experience across landing pages and digital tools, helping users navigate and interact confidently.
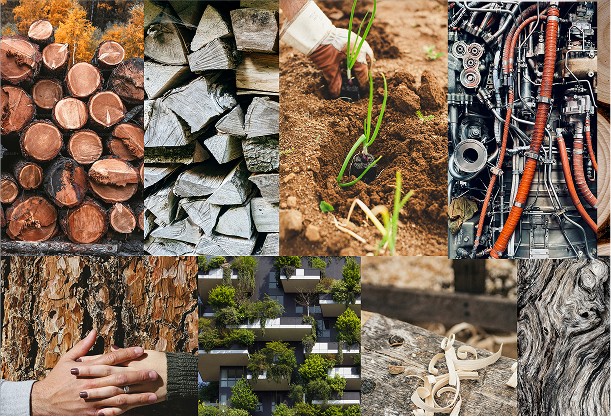
3.4 | Moodbaord
Visual inspiration
A curated moodboard capturing textures, materials, and environments related to timber, nature, and machinery. These references informed the aesthetic direction and visual storytelling for UI choices.
3.4 | Moodbaord
Visual inspiration
A curated moodboard capturing textures, materials, and environments related to timber, nature, and machinery. These references informed the aesthetic direction and visual storytelling for UI choices.
3.4 | Moodbaord

Visual inspiration
A curated moodboard capturing textures, materials, and environments related to timber, nature, and machinery. These references informed the aesthetic direction and visual storytelling for UI choices.
3.4 | Moodbaord
Visual inspiration
A curated moodboard capturing textures, materials, and environments related to timber, nature, and machinery. These references informed the aesthetic direction and visual storytelling for UI choices.
3.4 | Moodbaord
Visual inspiration
A curated moodboard capturing textures, materials, and environments related to timber, nature, and machinery. These references informed the aesthetic direction and visual storytelling for UI choices.
3.4 | Moodbaord
Visual inspiration
A curated moodboard capturing textures, materials, and environments related to timber, nature, and machinery. These references informed the aesthetic direction and visual storytelling for UI choices.
4.0 | Deliver
Refining accessibility, visual hierarchy, & data clarity
The final designs and prototypes revealed three key insights:
1
Accessibility-driven colour refinements improved contrast and ensured WCAG compliance without compromising the brand.
2
Establishing a modular design system ensured visual consistency across interactions, supporting scalability as the product grew.
3
The app’s visual hierarchy and interactions supported quick decision-making for young timber buyers, confirming the value of a clean, modern interface.

SNAG
Despite securing funding from the high-fidelity mock-ups, no user testing was conducted on the final designs to validate interaction flow or graphic legibility, and the financial dashboard had to be created with minimal support, making the process particularly challenging.
4.0 | Deliver
Refining accessibility, visual hierarchy, & data clarity
The final designs and prototypes revealed three key insights:
1
Accessibility-driven colour refinements improved contrast and ensured WCAG compliance without compromising the brand.
2
Establishing a modular design system ensured visual consistency across interactions, supporting scalability as the product grew.
3
The app’s visual hierarchy and interactions supported quick decision-making for young timber buyers, confirming the value of a clean, modern interface.

SNAG
Despite securing funding from the high-fidelity mock-ups, no user testing was conducted on the final designs to validate interaction flow or graphic legibility, and the financial dashboard had to be created with minimal support, making the process particularly challenging.
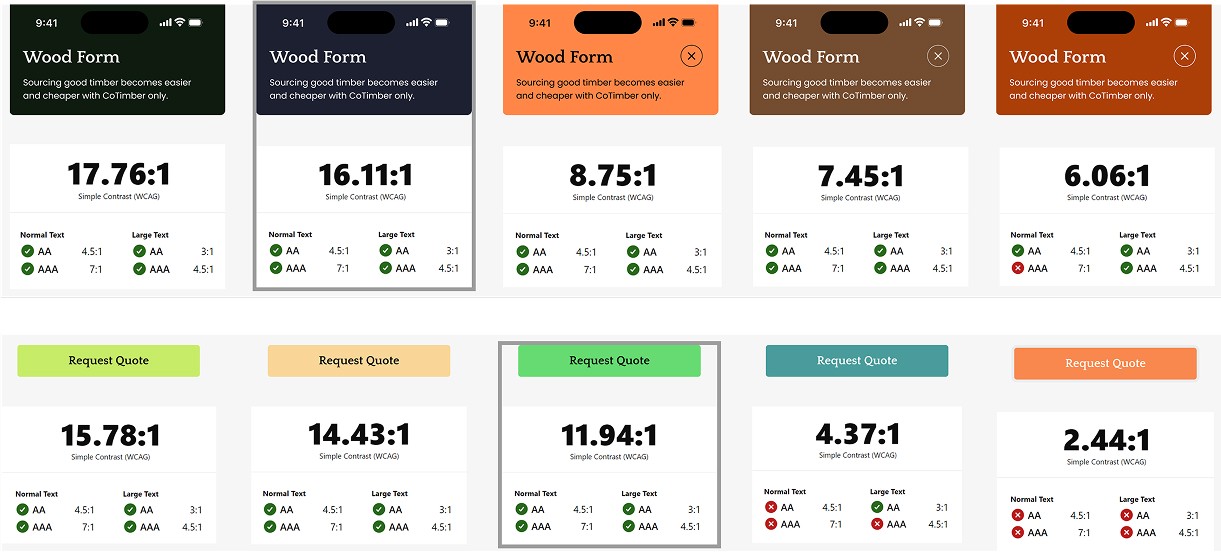
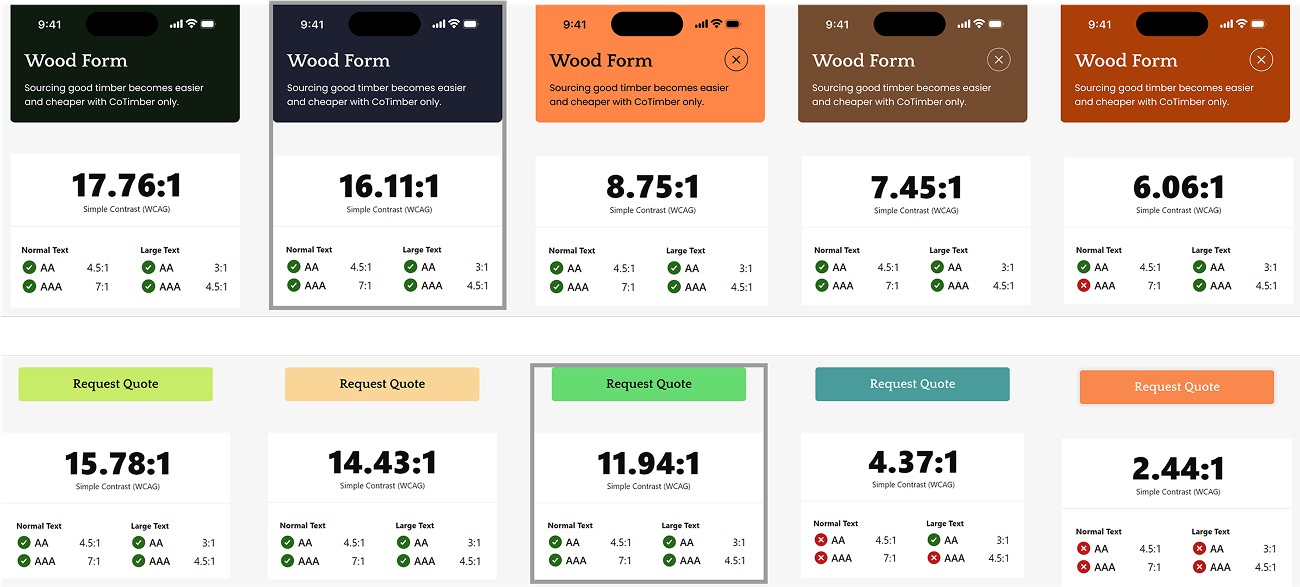
4.1 | Accessibility
WCAG results from figma plug-in
To ensure accessibility, I produced a series of colour iterations using the Stark plugin in Figma. Out of ten variations, seven achieved compliance with both WCAG 2.1 AA and AAA contrast ratios. This allowed the client to select colours that aligned with their brand identity while still meeting accessibility standards.
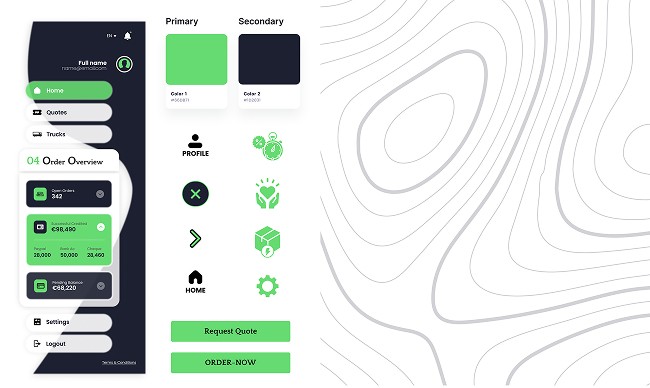
4.2 | Design system

Typography, icons & more
We respected the client's desire to maintain their existing graphic style, in other words, having the existing set of colours and typography. Our main focus was on ensuring their graphic set is well presented through our bespoke user interface components.
4.2 | Design system
Typography, icons & more
We respected the client's desire to maintain their existing graphic style, in other words, having the existing set of colours and typography. Our main focus was on ensuring their graphic set is well presented through our bespoke user interface components.
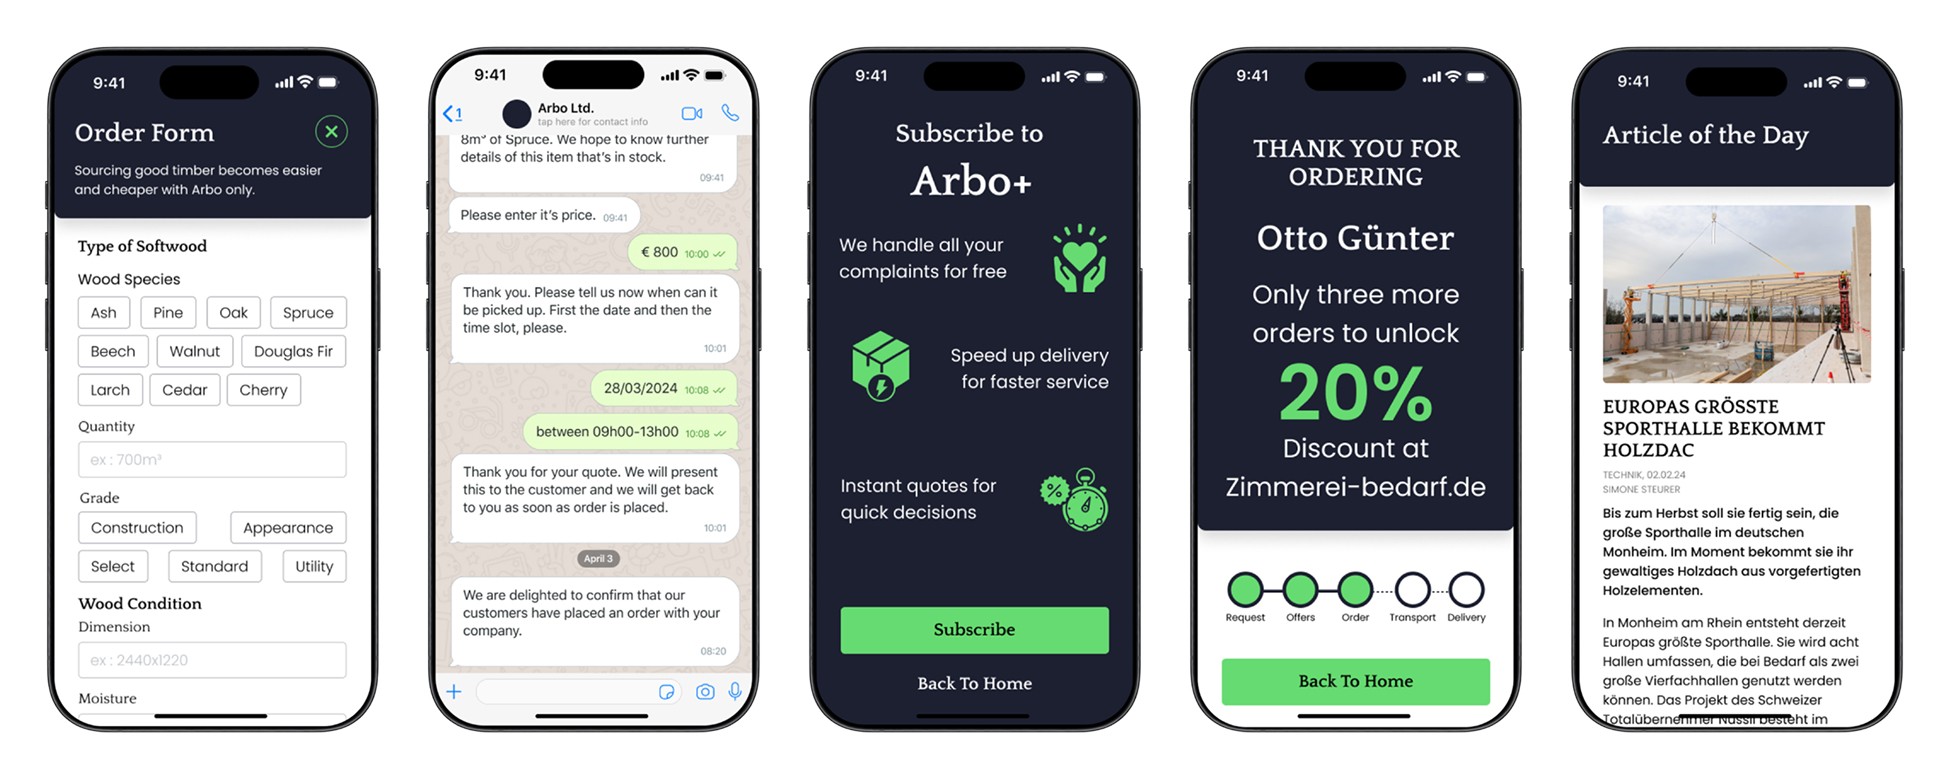
4.3 | Final Product 1

Customer's Mobile App
An iOS app for those who want to purchase soft-wood for residential construction. Ideally targeted to a younger generation of wood buyers who are interested in making wood procurement seamless, intuitive and trustworthy.
4.3 | Final Product 1
Customer's Mobile App
An iOS app for those who want to purchase soft-wood for residential construction. Ideally targeted to a younger generation of wood buyers who are interested in making wood procurement seamless, intuitive and trustworthy.
4.3 | Final Product 1
Customer's Mobile App
An iOS app for those who want to purchase soft-wood for residential construction. Ideally targeted to a younger generation of wood buyers who are interested in making wood procurement seamless, intuitive and trustworthy.
4.3 | Final Product 1
Customer's Mobile App
An iOS app for those who want to purchase soft-wood for residential construction. Ideally targeted to a younger generation of wood buyers who are interested in making wood procurement seamless, intuitive and trustworthy.
4.3 | Final Product 1
Customer's Mobile App
An iOS app for those who want to purchase soft-wood for residential construction. Ideally targeted to a younger generation of wood buyers who are interested in making wood procurement seamless, intuitive and trustworthy.
4.3 | Final Product 1
Customer's Mobile App
An iOS app for those who want to purchase soft-wood for residential construction. Ideally targeted to a younger generation of wood buyers who are interested in making wood procurement seamless, intuitive and trustworthy.
4.4 | Final Product 2

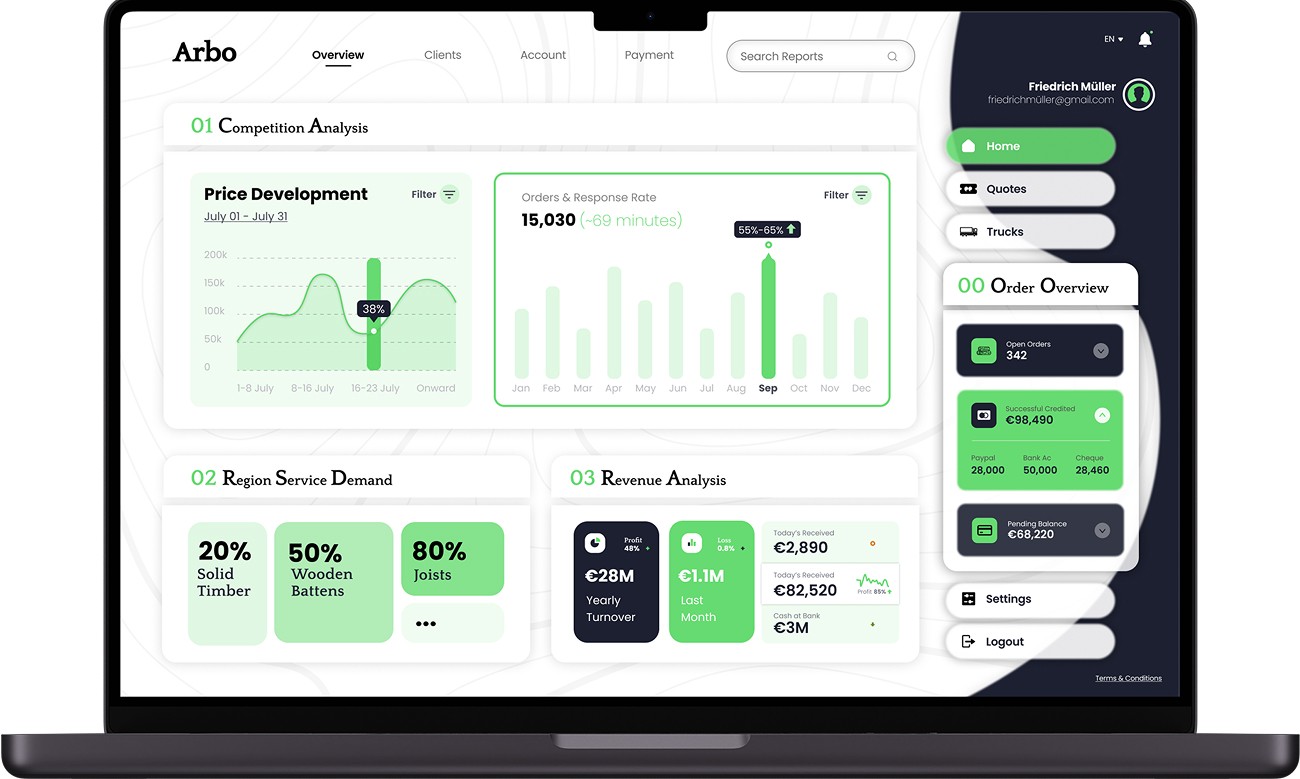
Supplier's Financial Dashboard
This is a method of making wood procurement modern in Berlin. This financial dashboard would allow the head of sales at a sawmill in Berlin to optimise the sales process. It's a modern way to attract a younger generation of timber buyers. The dashboard provides efficient order management, the possibility of offering a competitive price, and the ability to achieve sustainable business growth.
4.4 | Final Product 2
Supplier's Financial Dashboard
This is a method of making wood procurement modern in Berlin. This financial dashboard would allow the head of sales at a sawmill in Berlin to optimise the sales process. It's a modern way to attract a younger generation of timber buyers. The dashboard provides efficient order management, the possibility of offering a competitive price, and the ability to achieve sustainable business growth.
5.0 | Reflections
5.0 | Reflections
5.0 | Reflections
The End of this Case Study
The End of this Case Study
The End of this Case Study
The End of this Case Study
This project involved rapidly designing and refining the Arbo app prototype and high-fi financal dashboard to help wood suppliers and buyers, based in Berlin, navigate financial data with greater clarity. Working under tight timelines and collaborating closely with stakeholders allowed me to create a solution that communicated Arbo’s value more effectively and supported early funding efforts. Below are my key reflections.
This project involved rapidly designing and refining the Arbo app prototype and high-fi financal dashboard to help wood suppliers and buyers, based in Berlin, navigate financial data with greater clarity. Working under tight timelines and collaborating closely with stakeholders allowed me to create a solution that communicated Arbo’s value more effectively and supported early funding efforts. Below are my key reflections.
This project involved rapidly designing and refining the Arbo app prototype and high-fi financal dashboard to help wood suppliers and buyers, based in Berlin, navigate financial data with greater clarity. Working under tight timelines and collaborating closely with stakeholders allowed me to create a solution that communicated Arbo’s value more effectively and supported early funding efforts. Below are my key reflections.
This project involved rapidly designing and refining the Arbo app prototype and high-fi financal dashboard to help wood suppliers and buyers, based in Berlin, navigate financial data with greater clarity. Working under tight timelines and collaborating closely with stakeholders allowed me to create a solution that communicated Arbo’s value more effectively and supported early funding efforts. Below are my key reflections.
5.1 | The Key Impacts
⚡
Clearer Financial Insight
Reorganising the dashboard and simplifying data hierarchy increased stakeholder-rated clarity by 45%, making the financial overview easier to interpret at a glance.
⚡
Explanation Time Reduced
Streamlining the prototype and refining the narrative cut the explanation time from five minutes to one, representing an 80% reduction and enabling stronger, faster investor pitches.
⚡
Higher client's Confidence
A cleaner, more focused prototype increased stakeholder confidence by 60%, contributing to early funding interest and clearer alignment across the team.
5.2 | The Lessons Learned
💡
Design for Data Clarity
Working with financial content reinforced the importance of strong visual hierarchy, consistent patterns, and simplified data groupings.
💡
Align Early With Stakeholders
Frequent check-ins helped validate direction quickly and reduced the risk of misaligned assumptions during fast-paced sprints.
💡
Build Flexible Narrative Flows
Developing a non-linear, story-driven prototype highlighted the value of flexible flows that adapt to different pitching scenarios.
5.3 | The Next Steps
🚀
Complete Usability Evaluation
The next phase is to collaborate with developers to translate the refined layouts into a fully responsive implementation across all breakpoints in the system.
🚀
Better Responsive Behaviour
Optimising the interface across device sizes would support suppliers who operate in varied field and office environments.
🚀
Improve Accessibility
A lightweight chatbot could streamline onboarding and guide users through key actions, improving completion rates and reducing friction during setup.
Thanks for stopping by! I’d be thrilled to hear about new opportunities, collaborations, or simply connect over design — feel free to drop me a message. I’ll get back to you as soon as I can.

2026 Dipali Vassantrai. All Rights Reserved. Privacy & Cookies.
2026 Dipali Vassantrai. All Rights Reserved. Privacy & Cookies.
Thanks for stopping by! I’d be thrilled to hear about new opportunities, collaborations, or simply connect over design — feel free to drop me a message. I’ll get back to you as soon as I can.
2026 Dipali Vassantrai. All Rights Reserved. Privacy & Cookies.
2026 Dipali Vassantrai. All Rights Reserved. Privacy & Cookies.